
Figure 3. CD22 is highly clustered on the surface of resting B cells.
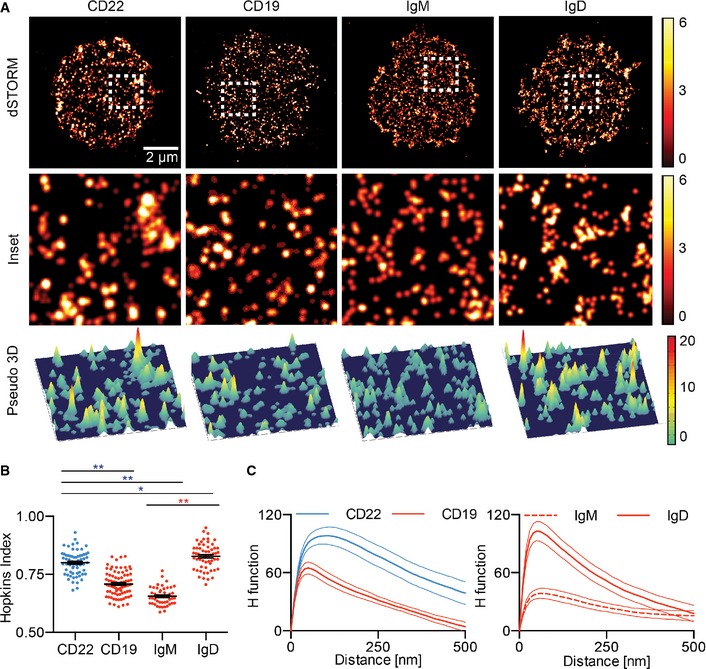
dSTORM analysis of CD22, CD19, IgM and IgD. Wild‐type primary B cells were stained with Alexa 647‐conjugated antibody against CD22, Cy5‐conjugated antibody against CD19 or IgD, or Cy5‐conjugated Fab fragments against IgM and settled onto non‐stimulatory coverslips. Cells were then fixed, imaged with dSTORM and analysed.
-
A2D (top and middle) and pseudo‐3D (bottom) dSTORM images were reconstructed from single‐molecule localizations. The white dashed square is shown in magnification (middle) and pseudo‐3D (bottom).
-
B, CQuantification of the distribution of CD22, CD19, IgM and IgD with H function and Hopkins index. Error bars (Hopkins index) and thin lines (H function) denote mean ± SEM. Data are pooled from at least three experiments per receptor. *P < 0.001, **P < 0.0001 (Student's t‐test).