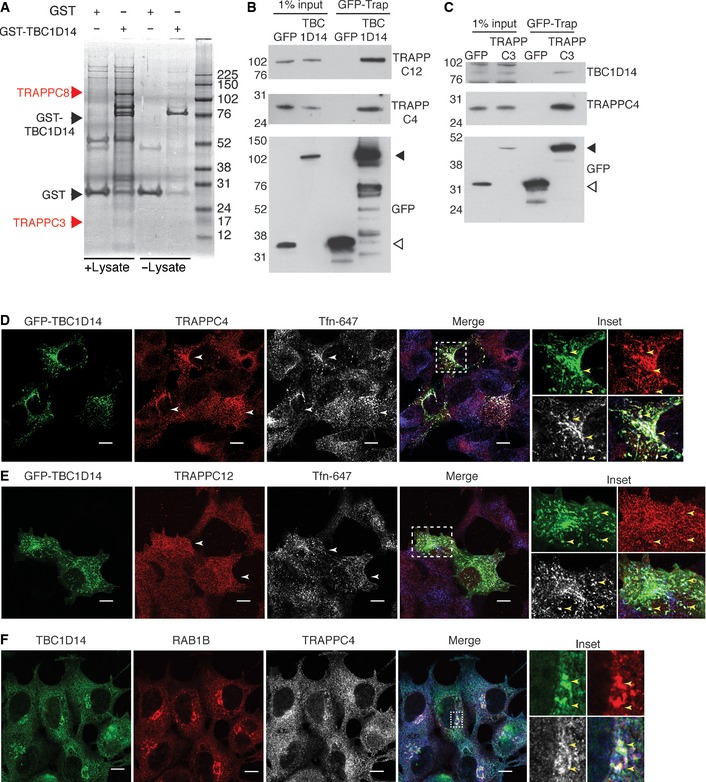
GST pulldown used to analyse TBC1D14 interactors. Recombinant GST or GST‐TBC1D14 was incubated with or without HEK293A lysate. Bound proteins were eluted from the beads using Laemmli sample buffer and subjected to SDS–PAGE, with visible bands being excised from the gel and analysed by mass spectrometry.
Lysates of HEK293A cells expressing either GFP or GFP‐TBC1D14 were subjected to immunoprecipitation (IP) with GFP‐Trap and then immunoblotted for GFP, TRAPPC12 and TRAPPC4. White arrowhead indicates GFP, black arrowhead indicates GFP‐TBC1D14.
Lysates of cells expressing GFP or GFP‐TRAPPC3 were subjected to IP with GFP‐Trap and then immunoblotted for TRAPPC4, GFP and TBC1D14. White arrowhead indicates GFP, black arrowhead indicates GFP‐TRAPPC3.
Cells expressing GFP‐TBC1D14, generating a tubulated endosomal compartment, were fed Alexa‐647‐labelled transferrin (white, blue in merge) for 15 min in full medium, fixed, stained for endogenous TRAPPC4 (red) and analysed by confocal microscopy.
Cells treated as in (D) were stained for endogenous TRAPPC12 (red) and analysed by confocal microscopy.
Cells in complete medium were fixed, stained for endogenous TBC1D14 (green), RAB1B (red) and TRAPPC4 (white, blue in merge) and analysed by confocal microscopy. Inset shows protein localisation in juxtanuclear area.
Data information: In (D–F), white arrowheads indicate transfected cells, and yellow arrowheads depict regions of co‐localisation in the inset. Scale bars, 10 μm. Data shown in (B‐F) are representative of 3 independent experiments.