
Figure 2. GSK3 inhibition reduces activity of the transcriptional repressor Tcf7l1.
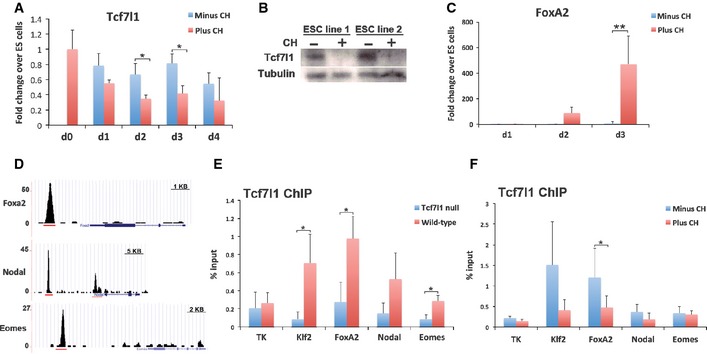
- Assay of Tcf7l1 mRNA by RT–PCR for the first 4 days of differentiation in the presence or absence of 3 μM CH. Average and SD of three independent experiments. Day 2: *P = 0.048, Day 3: *P = 0.036.
- Immunoblot for Tcf7l1 at day 3 of differentiation in the presence (+) or absence (−) of 3 μM CH. Tubulin was used as a loading control.
- Assay of FoxA2 mRNA by RT–PCR for the first 3 days of differentiation in the presence or absence of 3 μM CH. Average and SD of three independent experiments. **P = 5 × 10⁻⁷.
- ChIP‐seq data from a compendium of transcription factor ChIP‐seq analyses (Sánchez‐Castillo et al, 2015). Gene tracks represent binding of Tcf7l1 at the FoxA2, Nodal and Eomesodermin (Eomes) gene locus. Red lines indicate the regions analysed by ChIP‐PCR for Tcf7l1.
- ChIP for Tcf7l1 followed by qPCR for the regions indicated in (D). Analysis was performed in wild‐type ES cells in 2i culture conditions. Average and SD of three independent experiments. Klf2: *P = 0.025, FoxA2: *P = 0.050, Eomes. *P = 0.023.
- ChIP for Tcf7l1 followed by qPCR. Analysis was performed in wild‐type ES cells on day 3 of differentiation in the presence or absence of 3 μM CH. Average and SD of three independent experiments. FoxA2: *P = 0.049.
Source data are available online for this figure.