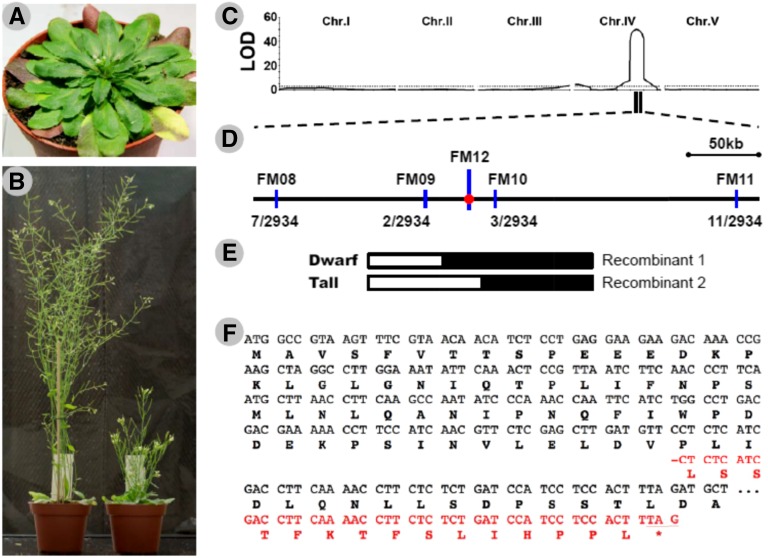
Figure 1.
Map-based cloning of the dwarfing gene. A, An SAO plant showing the morphology when the first flower opens in the greenhouse. B, Adult plants of Columbia (Col-0; left) and SAO (right) in the greenhouse. C, Logarithm of odds (LOD) maps of quantitative trait locus (QTL) analysis for total plant height in an F2 population derived from a cross between Col-0 (mother) and SAO (father). The dashed line indicates the position of the genome-wide significance threshold (LOD = 3.0). Chr., Chromosome. D, High-resolution linkage map of the GA5 region generated with 1,467 F2 plants of three near-isogenic lines. The number of detected recombinants between each indicated marker (blue lines) and FM12 (a molecular marker located in the GA5 gene shown by the red point) and the total number of examined chromosomes are shown under the map. E, Recombinants identified from the near-isogenic line populations delimit the causal locus to the 54-kb region between markers FM09 and FM10. White and black boxes indicate homozygous chromosomal segments from Col-0 and SAO, respectively. F, The beginning portion of the coding region and deduced amino acid sequences of the Arabidopsis GA5 gene. The sequence from Col-0 is shown in black, and the SAO frameshift sequence between a 1-bp deletion and the resulting stop codon is shown in red. −, The 1-bp deletion at position 184 of the SAO ga5 gene (ga5-184); *, the premature stop codon caused by the deletion.

