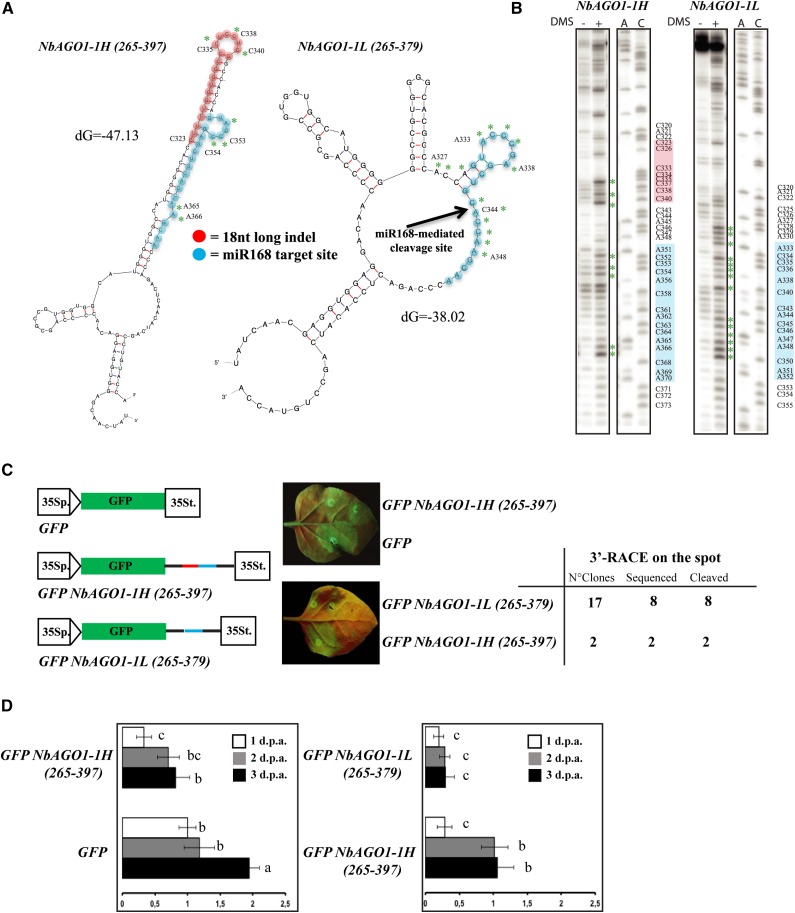
Figure 3.
miR168-resistent target site in NbAGO1-1. A, Mfold output showing the secondary structures of NbAGO1-1H (left) and NbAGO1-1L (right) in the region containing the miR168 target site. B, Chemical probing (DMS) of RNA secondary structure and primer extension analysis. Green asterisks in A and B indicate modified bases. C, In vivo analysis of GFP NbAGO1-1 sensor sequences. Spots in leaf halves were infiltrated with A. tumefaciens containing the indicated sensor sequences. The miR168 target site sequence is shown in red; the differential 18-nucleotide-long indel is shown in blue. At right is a table showing the 3′-RACE analysis on the spot. D, Relative expression levels of GFP mRNA in the analysis of GFP NbAGO1-1 sensor sequences. Data are presented as means ± se of three replicates; different letters denote significant differences at P ≤ 0.05. GFP mRNA at 1 dpa = 1.

