Figure 5.
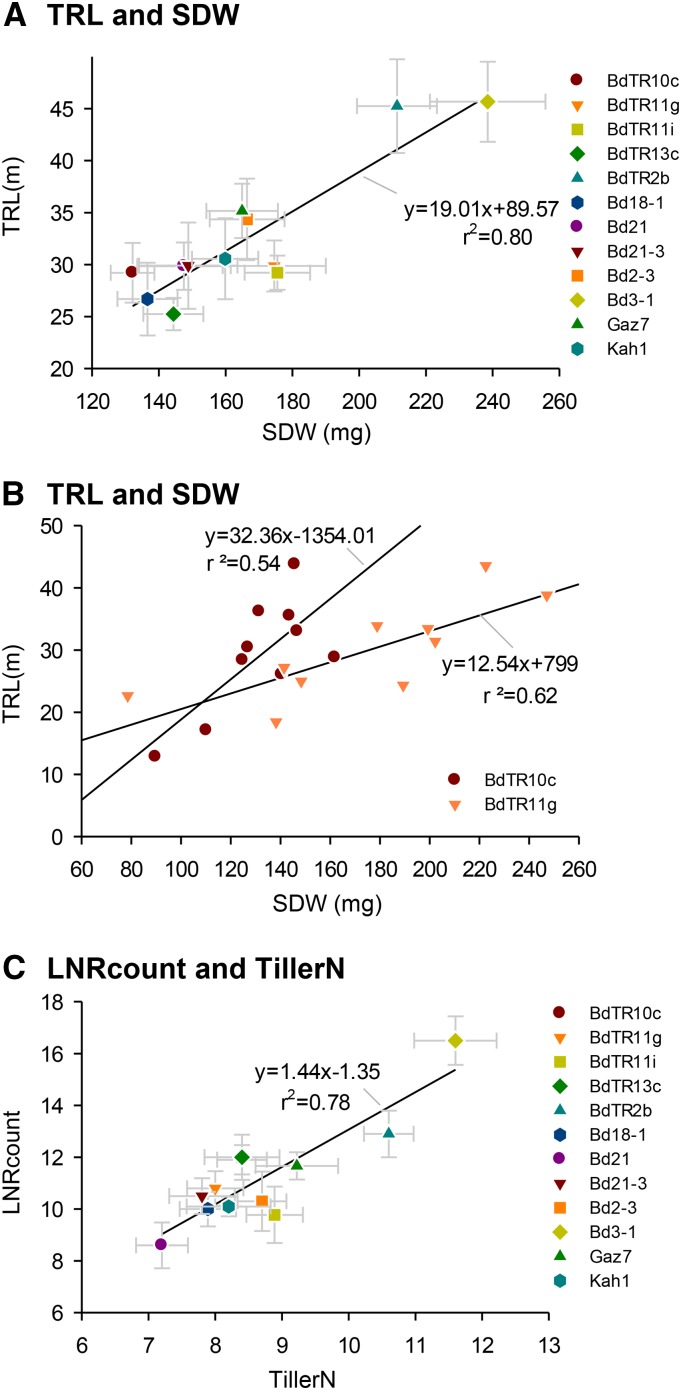
A, Root and shoot partitioning among 12 B. distachyon lines in experiment 9 (for details about the experiment, see Supplemental Table S1). B, Relationship between TRL and SDW in lines BdTR10c and BdTR11g only. C, Relationship between LNRcount and the number of tillers (TillerN) in 12 genotypes. Error bars represent sem (n = 10).

