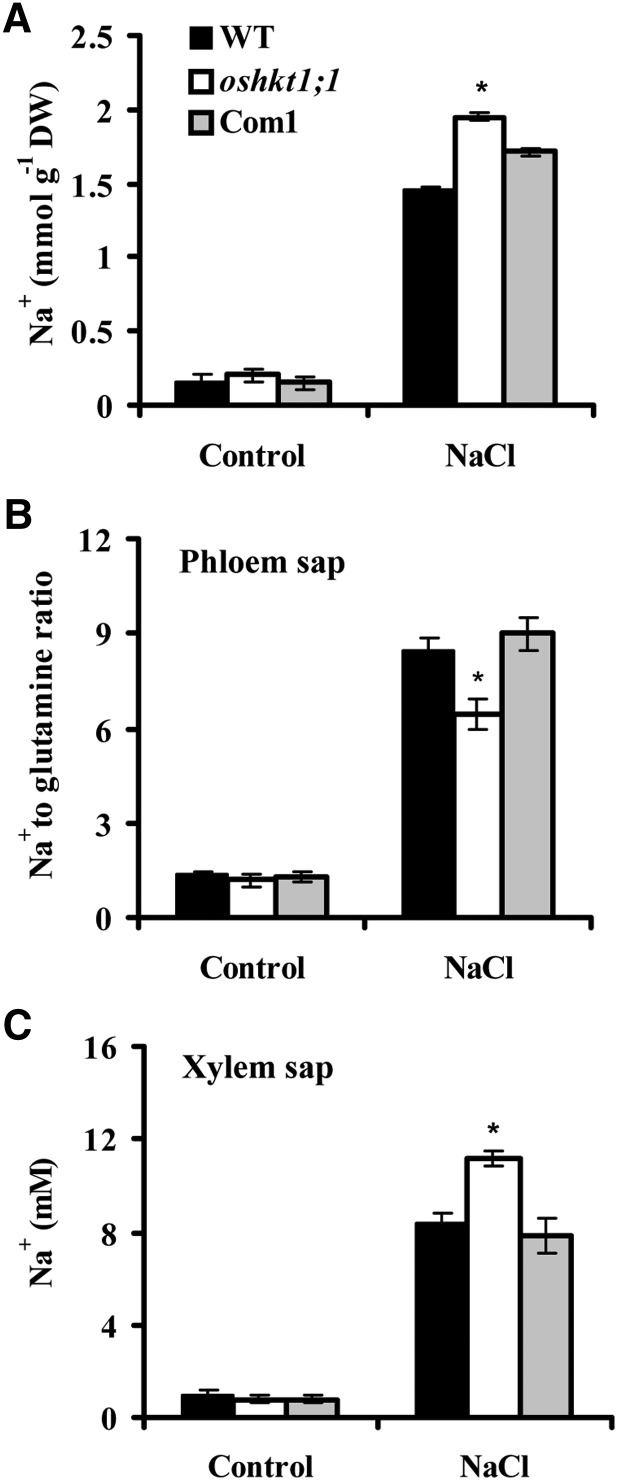
Figure 2.
Na+ content in rice plants. A, Na+ content in shoots. Hydroponically grown seedlings were treated with 100 mm NaCl for 7 d, and the shoots were harvested for Na+ content assay. Error bars represent se (n = 5). DW, Dry weight. B, The oshkt1;1 mutant plants show a decreased Na+ content in the phloem sap. Seedlings were hydroponically grown in culture solution for 21 d, then for 2 d in culture solution supplemented with 25 mm NaCl, before phloem sap was collected. One sample contained phloem sap from four seedlings. Gln content was used as an internal standard. Error bars represent se (n = 4). C, The oshkt1;1 mutant plants display an increased Na+ concentration in the xylem sap. Seedlings were grown as in B. One sample contained xylem sap from 35 seedlings. Error bars represent se (n = 4). Asterisks indicate statistically significant differences compared with the wild type (WT): *, P < 0.05.

