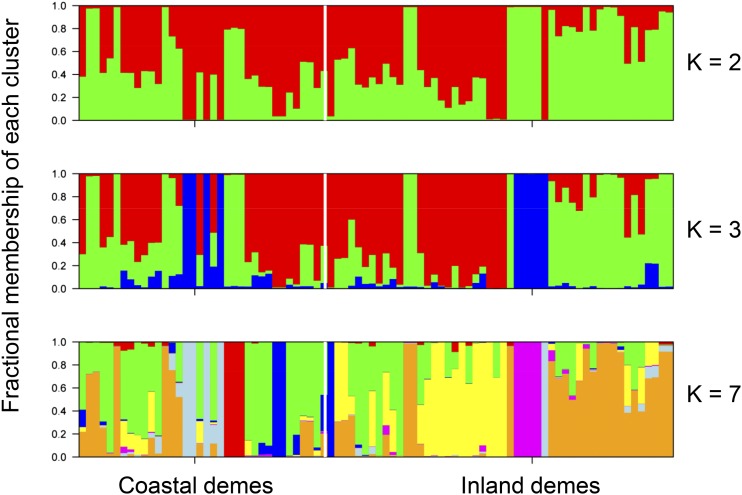
Figure 2.
Estimation of the genetic structure within the Catalonian Arabidopsis population. Each vertical bar represents an individual plant genotyped at 425 genome-wide SNP markers, and each bar is divided into K colored sections that indicate the fractional membership of an individual in K clusters based on its genotype. The figure of each K is based on the analysis with highest probability for that value of K. Vertical white lines divide demes of coastal and inland origins. Supplemental Table S2 shows details of which demes were genotypes.

