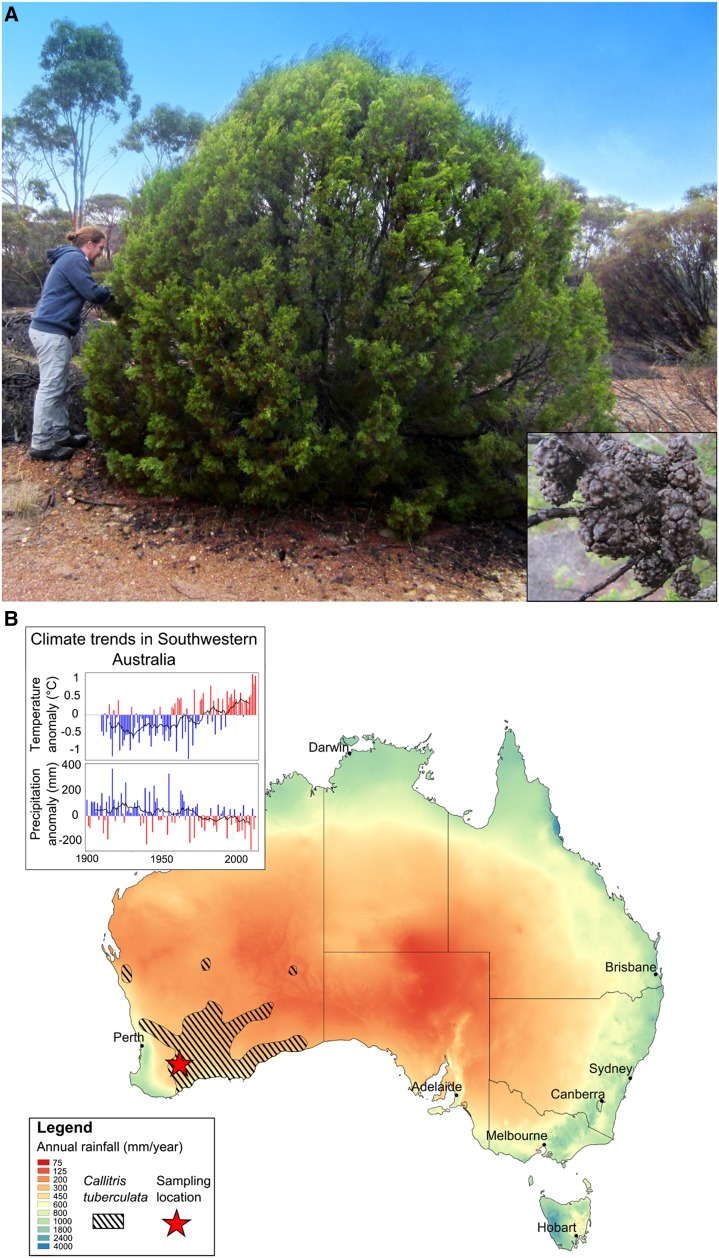
Figure 1.
C. tuberculata appearance, distribution range, and climate. A, C. tuberculata from the sampled population near Lake Grace in Western Australia. The inset shows a close-up view of the tuberculate female cones of this species (photograph by A. Wesolowski). B, Map of Australia showing C. tuberculata’s distribution (hatched area; the red star is the sampling location). Background colors represent mean annual precipitations. The inset at top left shows annual rainfall and temperature anomalies over the 20th century compared with the average (1961–1990) for southwestern Australia. Red bars highlight hot and/or dry years, and the black line indicates the 10-year moving average.

