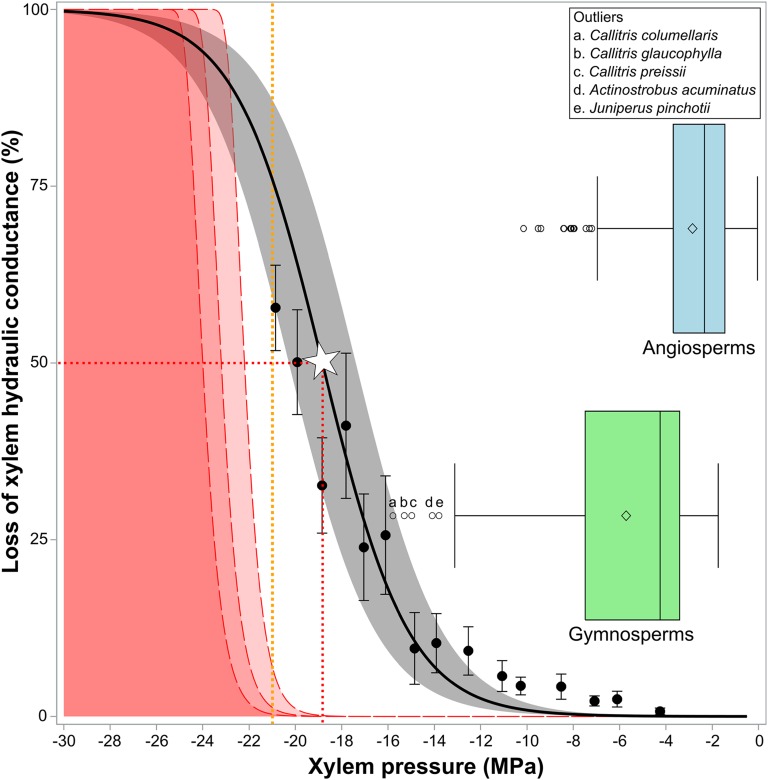
Figure 2.
Vulnerability curve for C. tuberculata. Points show average loss of conductance ± se for 15 pressure classes across all individuals. The black line is the Pammenter model for the species average P50 (white star) and slope; the gray shaded area shows 95% confidence limits for the mean. The orange vertical line represents the maximum speed of the centrifuge. The red dashed curves and the red shaded area show bulk cavitation probability curves at 20°C, 30°C, and 40°C (from left to right). Box plots show the distribution of published P50 values for 384 angiosperm species (light blue) and 160 gymnosperm species (green). Outliers are detailed in the inset at top right.

