Figure 3.
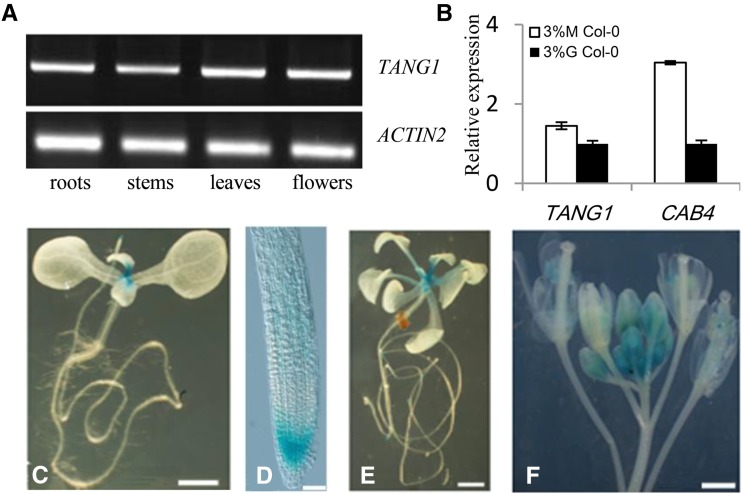
Expression patterns of the TANG1 gene. A, RT-PCR analysis of TANG1 gene expression. Total RNA was extracted from roots, stems, leaves, and flowers. The ACTIN2 gene was used as a reference for relative mRNA levels. B, Quantitative RT-PCR was used to assay TANG1 expression from cDNA from 9-d-old Col-0 seedlings induced by 3% (w/v) mannitol (M) or 3% (w/v) Glc (G) for an additional 12 h. The ACTIN2 gene was used as a reference for relative mRNA levels. The mRNA levels in Glc-treated Col-0 were set to 1. Data represent means ± se of three independent biological replicates. C to F, Histochemical analysis of GUS activity of pTANG1::GUS transgenic plants: 10-d-old seedlings (C), root meristem (D), 18-d-old seedlings (E), and inflorescences (F). Bars = 1 mm in C, E, and F; bar = 50 mm in D.

