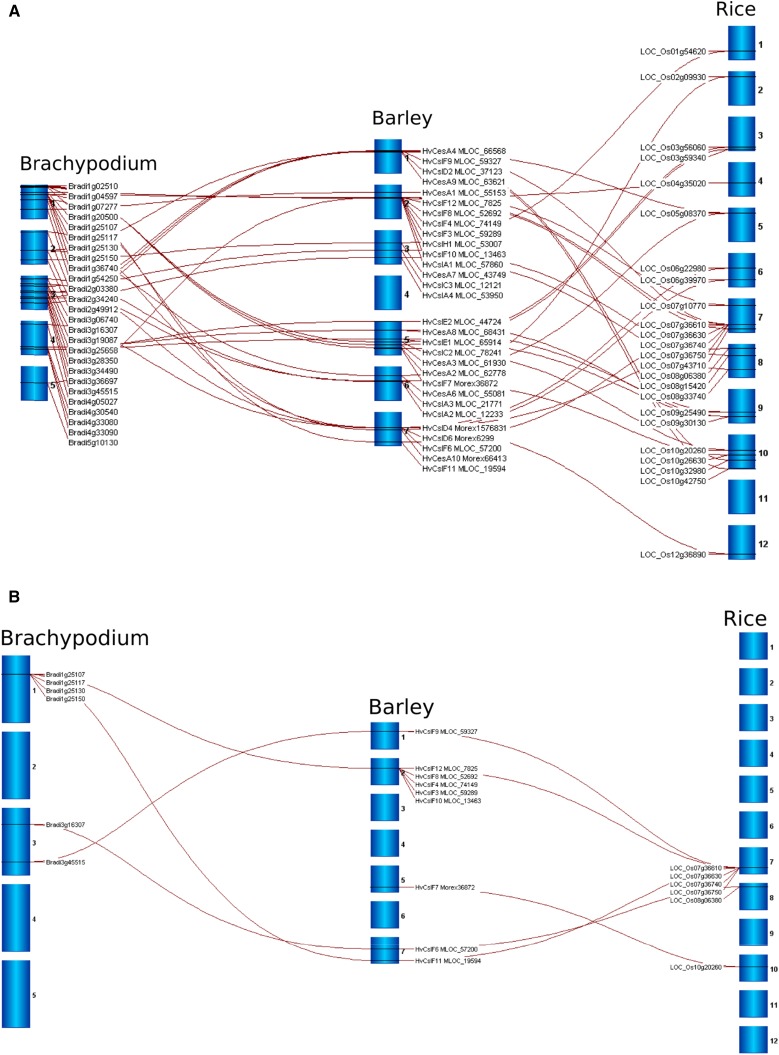
Figure 1.
A, Map of B. distachyon, barley, and rice chromosomes (blue) showing conserved synteny (red lines) of CesA and Csl gene locations across these species, as visualized in Strudel (Bayer et al., 2011). B, Map of B. distachyon, barley, and rice chromosomes showing synteny of CslF cluster genes. Taxa labels and locus identifiers are presented in Supplemental Table S1.

