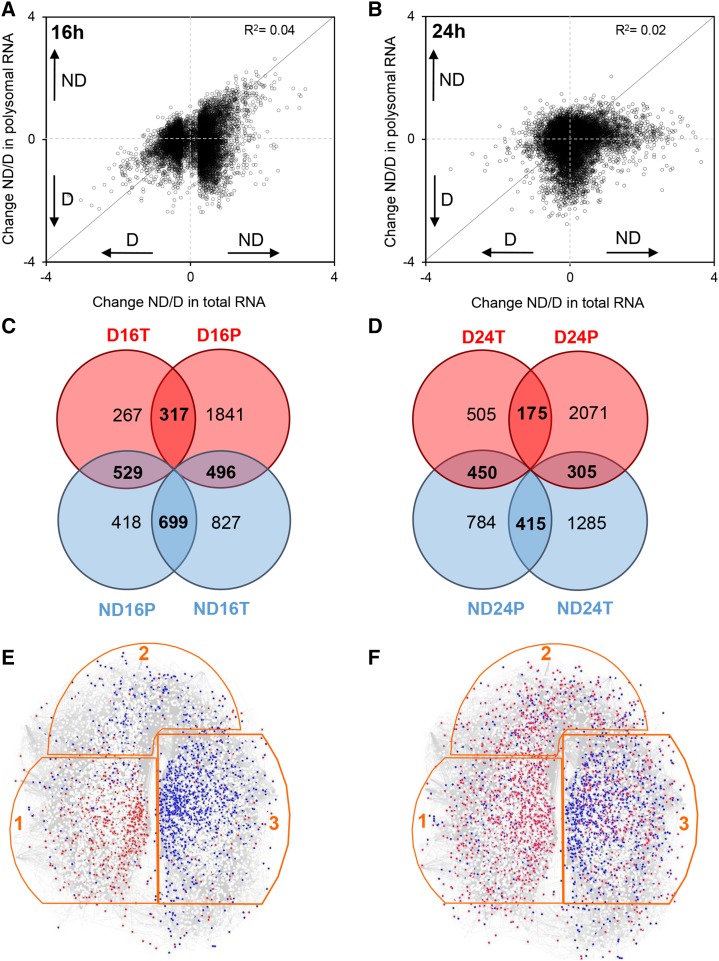
Figure 2.
Comparison of changes in mRNA abundance between the transcriptome and translatome. A and B, Scatterplots show the change (abundance in nondormant seeds/abundance in dormant seeds [ND/D]) in total mRNA abundance (x axis; transcriptome) versus change in polysomal mRNA (y axis; translatome) seeds after 16 h (A) or 24 h (B) of imbibition at 25°C. All transcripts present on the microarray are shown as dots on the graphs, which represent their ratio of log2 (abundance in nondormant seeds) to log2 (abundance in dormant seeds). The transcripts above or below the solid diagonal line are positively or negatively regulated at the level of translation, respectively. C and D, Venn diagrams show the number of transcripts displaying significant changes in abundance (after BH correction with P < 0.05 and log2 ratio above 0.5 or under −0.5) in transcriptome (T) and translatome (P) at 16 h (C) or 24 h (D) of imbibition at 25°C. E and F, Localization of transcripts associated with the transcriptome and translatome in the SeedNet transcript coexpression network (www.vseed.nottingham.ac.uk). The regions outlined in orange correspond to clusters associated with dormancy (region 1) or germination (regions 2 and 3; Bassel et al., 2011). The red dots represent the transcripts identified in this study as more abundant in dormant seeds, and the blue dots represent the transcripts more abundant in nondormant seeds in the transcriptome (E) or translatome (F) after 16 and 24 h of imbibition at 25°C.

