Figure 3.
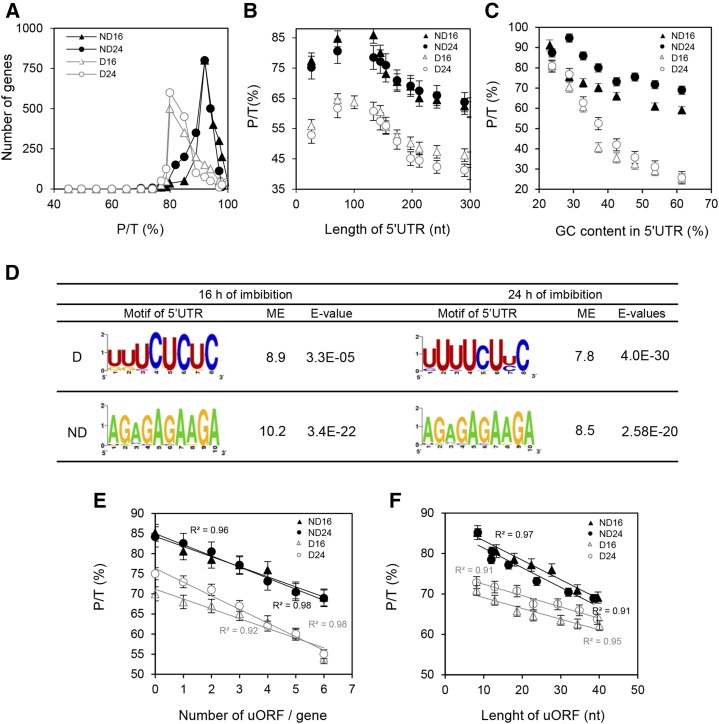
Regulation of polysome loading by 5′UTR. For all graphs, black symbols and black lines correspond to nondormant (ND) seeds, while white symbols and gray lines correspond to dormant seeds (D). Triangles and circles correspond to 16 and 24 h of imbibition, respectively. A, Distribution of the transcripts according to their polysomal ratio (P/T) in dormant seeds (n = 2,582 at 16 h and n = 2,581 at 24 h of imbibition) and nondormant seeds (n = 1,629 at 16 h and n = 1,601 at 24 h of imbibition). Distributions were statistically different between dormant and nondormant seeds at both durations of imbibition, as determined by Student’s t test (P < 0.0001). B, Relationship between the length of the 5′UTR and the polysomal ratio calculated for transcripts that were found in polysomal fractions of dormant and nondormant seeds. Transcripts were grouped based on 45 nucleotide (nt) classes. C, Effect of GC content in the 5′UTR on polysomal ratio. mRNAs were grouped based on 5% GC content windows, and the polysomal ratio was calculated for each subset. D, Consensus sequences of motifs overrepresented in the 5′UTR for the first 100 mRNAs identified as differentially abundant in the polysomal fraction of dormant and nondormant seeds at 16 and 24 h of imbibition. The motif enrichment (ME) represents the frequency of the motifs overrepresented in the 100 first differentially abundant transcripts relative to their frequency in the 5′UTR from the whole genome of Arabidopsis. The E value calculated by MEME reveals the statistical significance of the motif. E, Relationship between the number of uORFs per gene and the polysomal ratio in the polysomal fraction of dormant and nondormant seeds at 16 and 24 h of imbibition. F, Relationship between the length of uORFs and the polysomal ratio in the polysomal fraction of dormant and nondormant seeds at 16 and 24 h of imbibition.

