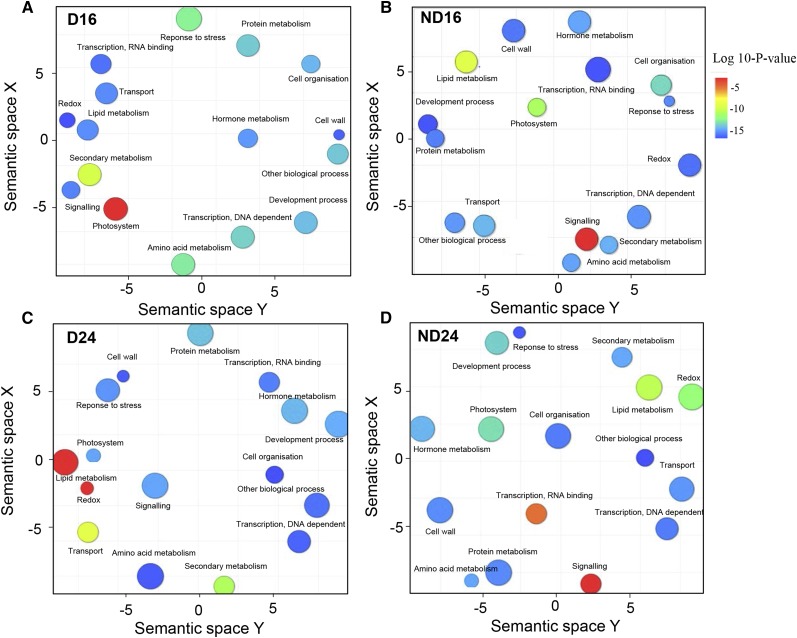
Figure 5.
GO classification of mRNAs specifically found in the translatome of dormant (D) and nondormant (ND) seeds after 16 h (A and B) and 24 h (C and D) of imbibition at 25°C. TAIR accession numbers were used to perform the classification according to GO categories with the Classification SuperViewer Tool in the Bio-Analytic Resource for Plant Biology, and plots were obtained using REVIGO (http://revigo.irb.hr; Supek et al., 2011), which allows a two-dimensional space representation according to the semantic similarity of GO terms (semantically similar GO terms remain close together in the plot). The size of the circles indicates the frequency of the GO term in the GO database (more general terms are represented by larger circles), and the color of the circles indicates the P value (scale at right; blue and green circles are GO terms with more significant P values than orange and red circles).

