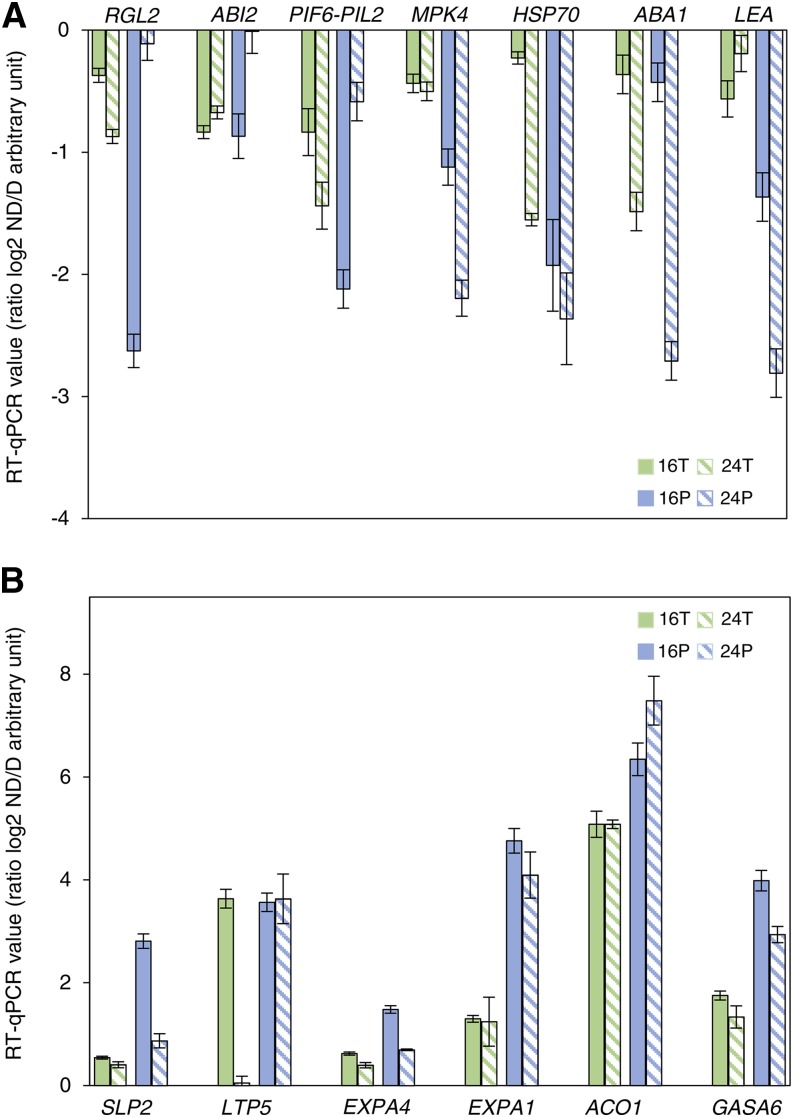
Figure 6.
Pattern of expression in the transcriptome and translatome of key transcripts more abundant in dormant seeds (log2 ratio ND:D < 0; A) and more abundant in nondormant seeds (log2 ratio ND:D > 0; B) after 16 and 24 h of imbibition. Expression data were obtained by qRT-PCR on three biological replicates. RGL2, At3g03450; ABI2, At5g57050; PIF6-PIL2, At3g62090; MPK4, At4g01370; HSP70, At5g02500; ABA1, At5g67030; LEA, At2g21490; SLP2, At4g34980; LTP5, At3g51600; EXPA4, At2g39700; EXPA1, At1g69530; AC1, At2g19590; GASA6, At1g74670. Green corresponds to changes measured in total RNA (T; transcriptome), and blue corresponds to changes in polysomal RNA (P; translatome) at 16 h (solid bars) and 24 h (striped bars) of imbibition.

