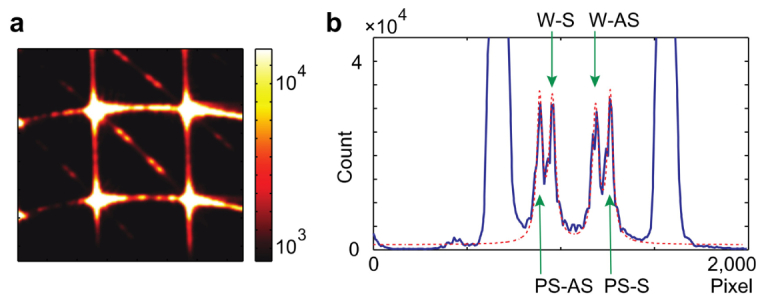
Fig. 2.

Water-Polystyrene optical spectra acquired with the two-stage VIPA spectrometer. (a) Spectrogram of two calibration materials (water and polystyrene cuvette). Color bar, number of photons. (b) 1-D plot of the Brillouin spectrum. Blue line: measured data, red dotted line: Lorentzian curve fit to the measured data.
