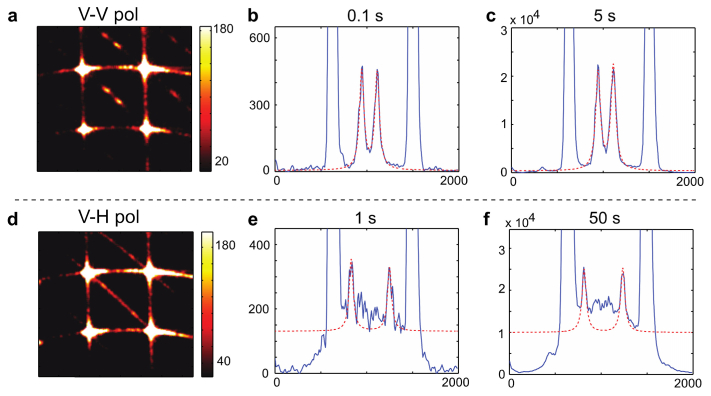
Fig. 3.
Brillouin spectra of polycarbonate for VV input-output polarization (a-c) and VH polarization (d-f). (a), (d): Spectrograms at 0.1 s and at 1 s, respectively. Color bar, number of photons (counts) (b), (c) 1-D plot of the spectra at 0.1 s and at 5 s, respectively. The measured Brillouin frequency shifts and linewidths are 11.68 ± 0.03 GHz and 0.36 GHz. (e), (f) 1-D plot of the spectra at 1 s and at 50 s, respectively. The measured Brillouin frequency shifts and linewidths are 5.16 ± 0.07 GHz and 0.68 GHz. (Blue line: measured data. Sampling points are interpolated by ten times. Red dotted line: Lorentzian curve fit to the measured data, x axis: pixel index, y axis: number of photons (counts) in (b), (c), (e) and (f)).

