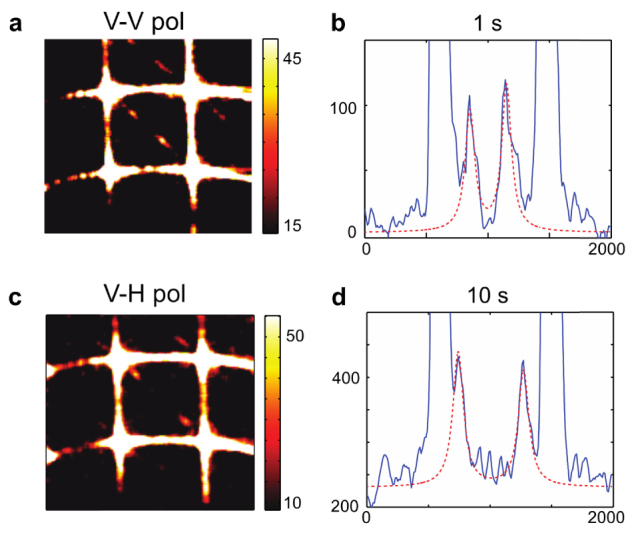
Fig. 4.

Brillouin spectra of fused quartz for VV (a-b) and VH (c-d). (a), (c): Spectrograms at 1 s and at 10 s, respectively. Color bar, number of photons (counts) (b): 1-D plot of the spectra of (a). The measured Brillouin frequency shifts and linewidths are 26.03 ± 0.15 GHz and 0.18 GHz. (d): 1-D plot of the spectra of (c). The measured Brillouin frequency shifts and linewidths are 15.9 ± 0.11 GHz and 0.57 GHz.
