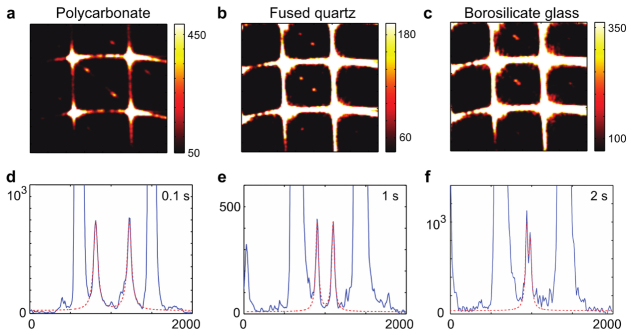
Fig. 7.
Optical spectra acquired with two-stage VIPA spectrometer. (a), (b), (c): Spectrograms of polycarbonate (0.1 s), fused quartz (1 s), borosilicate glass (2 s) for VV scattering, respectively. Color bar, number of photons (counts) (d), (e), (f): 1-D plot of the spectra of (a), (b), and (c), respectively experimental data (blue line); The curve fit based on Lorentzian functions (red dotted line); The measured Brillouin frequency shifts and linewidths are 14.55 GHz and 0.61 GHz for (d), 32.37 GHz and 0.18 GHz for (e), 30.56 GHz and 0.12 GHz for (f). (x axis: pixel index, y axis: number of photons (counts) in (d), (e) and (f)).

