Fig. 4.
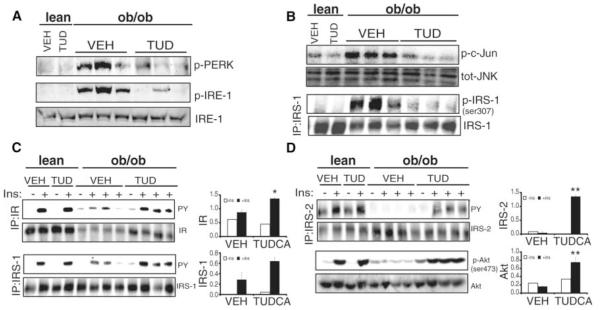
Effect of TUDCA treatment on ER stress parameters, JNK activation, and insulin receptor signal transduction pathway in the liver of ob/ob mice. (A) PERK (Thr-980) and IRE-1α phosphorylation, and total IRE-1α levels in liver tissues of TUDCA- or vehicle-treated ob/ob mice and lean controls. (B) JNK activity and IRS-1 (Ser-307) phosphorylation in liver tissues of ob/ob mice after TUDCA administration. (C) Insulin-stimulated tyrosine phosphorylation of insulin receptor and IRS-1. (D) Insulin-stimulated IRS-2 tyrosine, and Akt serine (Ser-473) phosphorylation in the liver tissues of TUDCA- and vehicle-treated ob/ob mice and lean WT controls. The graphs on the right of each blot demonstrate the quantitation of phosphorylation of each molecule. Data are presented as the means ± SEM, and asterisks indicate statistical significance determined by student’s t test (*P < 0.05, **P < 0.001).

