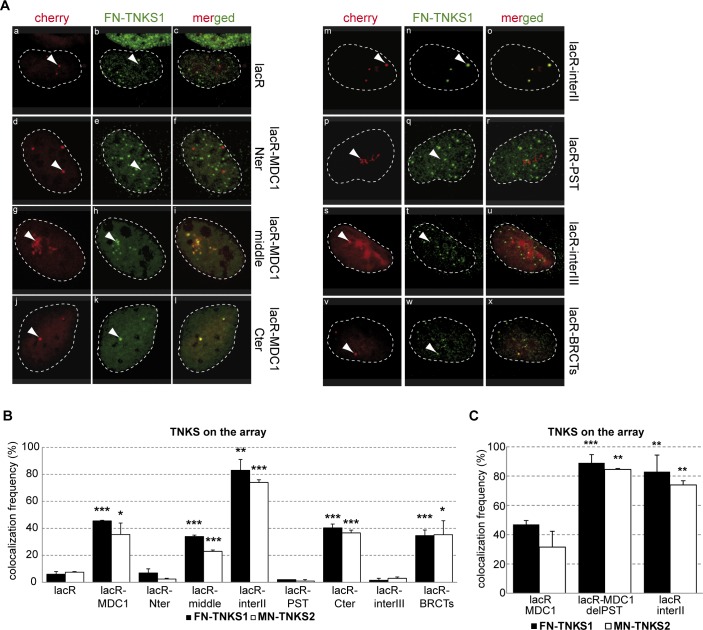
Fig 2. Mapping of the Tankyrase interacting domain of MDC1.
(A) Confocal microscopy images of U2OS17 cells transfected with different mCherry-lacR-MDC1 domain constructs and flag tagged TNKS1 (FN-TNKS1). The contour of nuclei is shown. Colocalization of the two proteins can be observed in the merged images. (B) Quantification of the colocalization frequency of flag-TNKS1 (FN-TNKS1) or myc-TNKS2 (MN-TNKS2) and the different tethered MDC1 domains. Values represent mean ± SD from three independent experiments (N = 100 cells in each experiment). Statistical significance in all relevant Figs was calculated using the t-test (P<0,05 *, P<0,01 **, P<0,001 ***) (C) The PST repeats of MDC1 regulate the interaction between Tankyrases and MDC1. U2OS17 cells were transfected with different constructs expressing cherry-lacR fused versions of MDC1 (marked on the X axis) and Tankyrase (TNKS1 or TNKS2). % of cells having Tankyrase on the array was determined as for panel (B).

