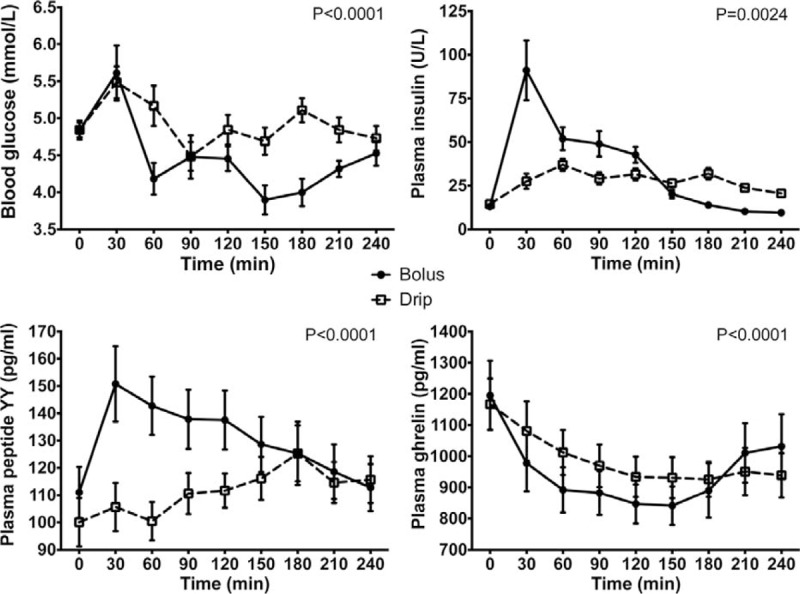
FIGURE 3.

Changes in concentrations of blood glucose, and plasma insulin, peptide YY, and ghrelin after nasogastric infusion of 400 mL of Nestle Resource Energy over 4 hours (continuous) or 5 minutes (bolus). All values are mean ± SEM. The P values are for the test of continuous drip versus bolus feeding using the analysis of variances and a repeated measures model.
