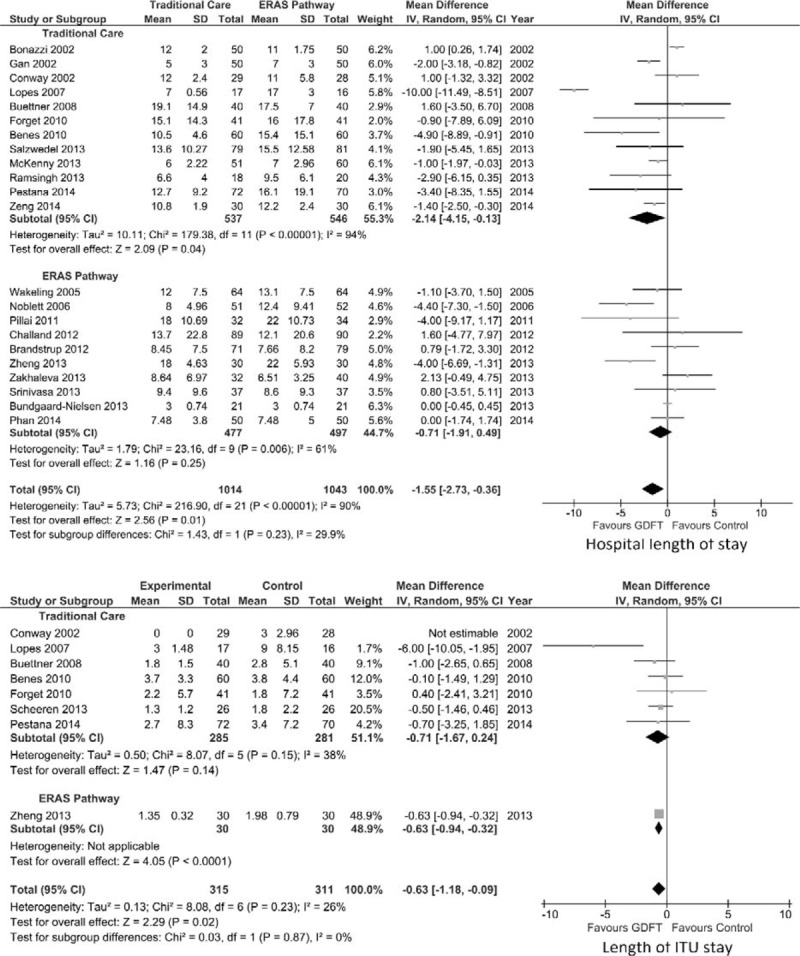
FIGURE 4.

Forest plot comparing overall hospital LOS (top) and intensive treatment unit (ITU) LOS (bottom) for patients receiving GDFT versus control including studies with estimated data, divided by those managed using ERAS or traditional principles. An inverse-variance random effects model was used to conduct the meta-analysis, and mean differences are quoted including 95% confidence intervals.
