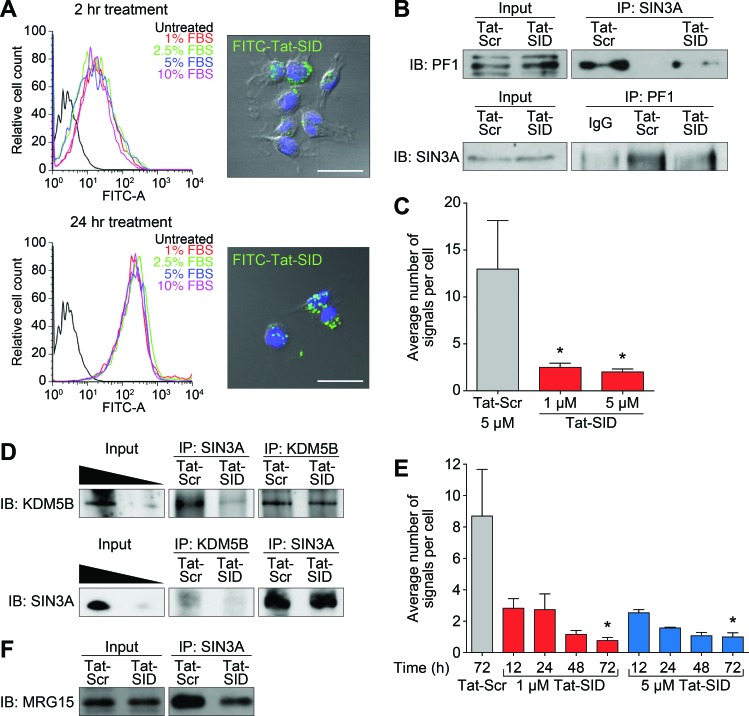
Figure 1. Tat-SID disrupts interaction between SIN3A and a chromatin regulating protein complex containing PF1, MRG15 and KDM5B.
A. Left, histograms showing cellular uptake of Tat-SID analyzed by flow cytometer in MDA-MB-231 cells treated with 1 μM FITC-conjugated Tat-SID for 2 h and 24 h in 1% (red), 2.5% (green), 5% (blue) and 10% (pink) serum. Black histogram represents untreated cells. Right, confocal images of MDA-MB-231 treated with 1 μM FITC-conjugated Tat-SID (green) and stained with nuclear stain DAPI (blue). Scale bars: 25 μm. B. IP-immunoblot analysis of MDA-MB-231 cells treated with 1 μM Tat-SID for 24 h, immunoprecipitated with anti-Sin3A antibody and immunoblotted with anti-PF1 antibody (upper panel), or immunoprecipitated with anti-PF1 antibody and immunoblotted with anti-Sin3A antibody (lower panel). Input corresponds to 10% of the total protein used for immunoprecipitation. C. Quantification of proximity ligation assay (PLA) analyzing the interaction between SIN3A and PF1 in MDA-MB-231 cells treated with 1 μM and 5 μM Tat-SID treatments respectively for 24 h (red) in comparison to Tat-Scr (grey). Tat-Scr versus 1 μM Tat-SID, *, p = 0.0251; Tat-Scr versus 5 μM Tat-SID, *, p = 0.0217; p, unpaired t-test. D. IP-immunoblot analysis of MDA-MB-231 cells treated with 1 μM Tat-SID for 24 h, immunoprecipitated with anti-Sin3A & anti-KDM5B antibodies and immunoblotted with anti-KDM5B antibody (upper panel), or immunoprecipitated with anti-KDM5B & anti-Sin3A antibodies and immunoblotted with anti-Sin3A antibody (lower panel). Input corresponds to 20% and 5% of the total protein used for immunoprecipitation. E. Quantification of PLA analyzing the interaction between SIN3A and KDM5B in MDA-MB-231 cells treated with 1 (red) and 5 μM Tat-SID (blue) for different time points in comparison to 5 μM Tat-Scr (grey). Tat-Scr versus 1 μM Tat-SID 72 h, *, p = 0.0119; Tat-Scr versus 5 μM Tat-SID 72 h, *, p = 0.0111; p, unpaired t-test. F. IP-immunoblot analysis of MDA-MB-231 cells treated with 1 μM Tat-SID for 24 h, immunoprecipitated with anti-Sin3A antibody and immunoblotted with anti-MRG15. Input corresponds to 10% of the total protein used for immunoprecipitation. Error bars represent mean ± SD (n = 3).

