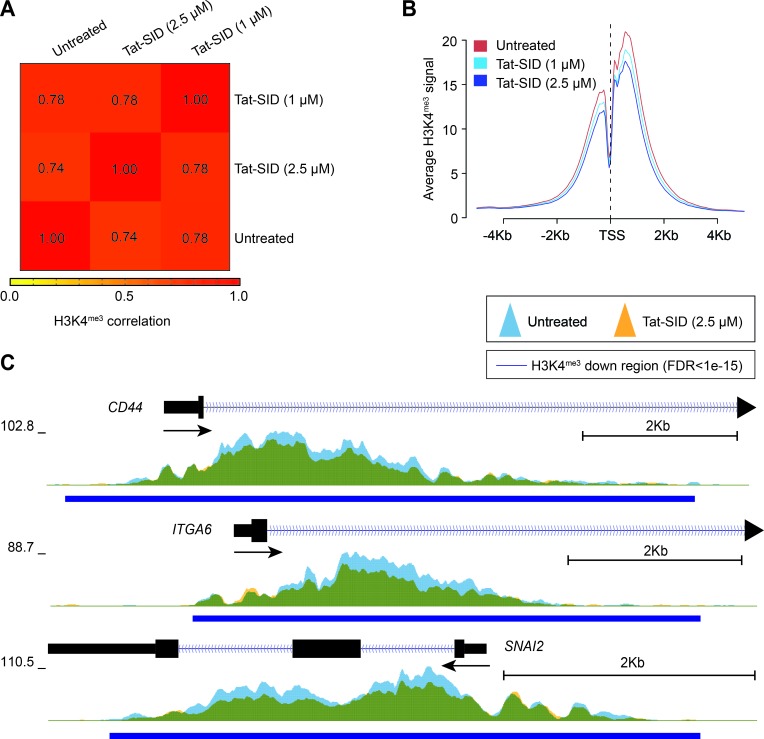
Figure 3. Tat-SID reduces global promoter H3K4 trimethylation.
A. Heatmap representing the correlation (Spearman) of the H3K4me3 ChIP signal between untreated (UT), 1 μM Tat-SID treated and 2.5 μM Tat-SID treated MDA-MB-231 cells. Unsupervised hierarchical clustering of samples is shown. B. Average H3K4me3 ChIP signal at all annotated TSS (−5Kb to +5Kb) in untreated and Tat-SID treated MDA-MB-231 cells. C. Overlaid H3K4me3 ChIP signal (fold enrichment over input) at the TSS of CD44, ITGA6 and SNAI2 in untreated (light blue) and 2.5 μM Tat-SID treated (orange) MDA-MB-231 cells. Regions with significantly decreased H3K4me3 signal (FDR < 1 × 10⁻¹⁵) are underscored (dark blue bars). Overlapped regions are shown as green.

