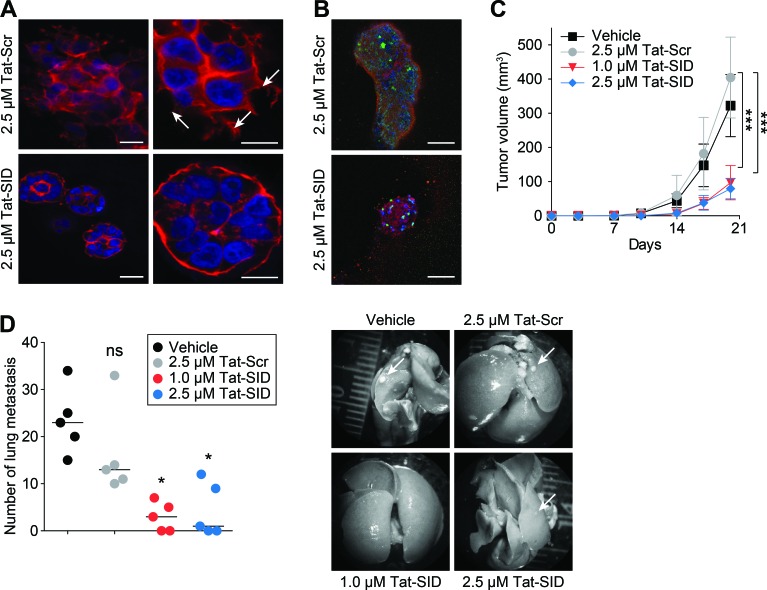
Figure 4. Tat-SID impairs invasive morphogenesis and induces anti-tumor effects.
A. Colony morphogenesis of MDA-MB-231 cells treated with Tat-Scr or Tat-SID at the indicated concentrations. Cells were cultured in 3D matrigel for 10 days followed by staining of colonies with phalloidin (red) and DAPI (blue nuclear stain). Arrows indicate invasive projections. Scale bars: 25 μm (left), 10 μm (right). B. MDA-MB-231 cells were treated with Tat-Scr or Tat-SID and cultured as described in (A). Colonies were stained with caspase-3 (green) and E-cadherin (red). Scale bars: 50 μm. C. Tumor progression in Balb/c mice (n = 5) inoculated with 4T1 cells treated with water, Tat-Scr (2.5 μM) or Tat-SID (1 μM and 2.5 μM) for 14 days, and tumor volume quantified at the indicated time points. Tat-Scr versus 1 μM Tat-SID day 20, ***, p = 0.0007; Tat-Scr versus 2.5 μM Tat-SID day 20, ***, p = 0.0003; p, unpaired t-test. D. Lungs from sacrificed animals in (C) (n = 5) were isolated and quantified for the number of metastasis observed. Left panel is quantification of number of metastatic foci observed on the surface of the lungs. Right panel is the image of lungs isolated from the sacrificed mice. Tat-Scr versus untreated, ns, p = 0.2107; Tat-Scr versus 1 μM Tat-SID, *, p = 0.0185; Tat-Scr versus 2.5 μM Tat-SID day 20, *, p = 0.0446; p, unpaired t-test. Error bars represent mean ± SD.

