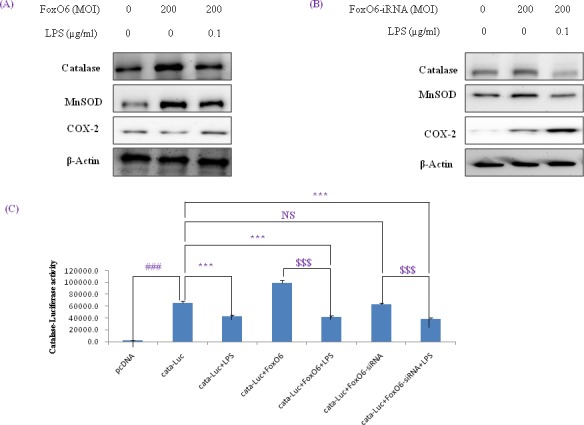
Figure 4. Activation of NF-κB by oxidative stress in HepG2 cells.

(A, B) Western blotting was used to assess COX-2, catalase, and MnSOD protein levels after pre-incubating HepG2 cells with FoxO6 (100 MOI) or FoxO6-siRNA (100 MOI) for 24 hr. C. Cells were transiently transfected with a catalase-containing plasmid linked to the luciferase gene, pre-incubated with FoxO6 (100 MOI) or FoxO6-siRNA (100 MOI) for 8 hr, and then treated with LPS for 2 hr. Results are presented in relative luminescence units (RLU). Results were obtained using one-factor ANOVA: ###p < 0.001 vs. untransduced cells; ***p < 0.001 vs. catalase-luciferase transduced cells; $$$p < 0.001 vs. catalase-luciferase transduced cell pre-incubated with FoxO6 virus or FoxO6-siRNA.
