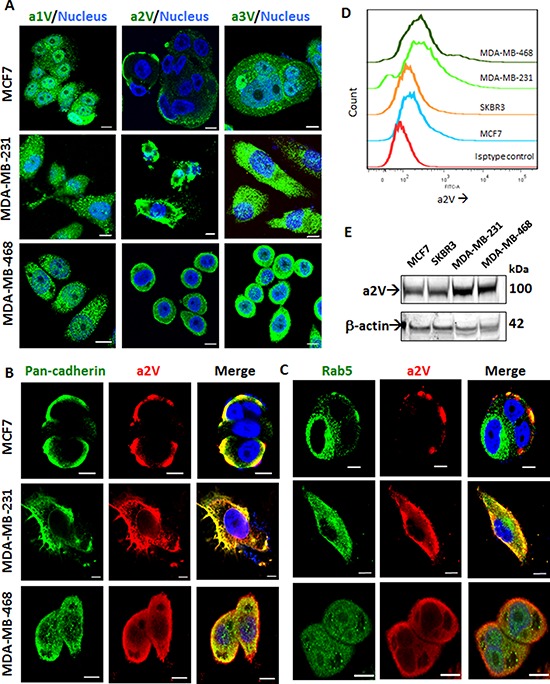
Figure 1. a2V is abundantly expressed on the surface of TNBC cells.

ER/PR positive MCF7, Triple–negative MDA-MB-231 and MDA-MB-468 cells were grown on chamber slides. Cells were fixed, permeabilized and processed for immunofluorescence microscopy. A. Representative images taken with a confocal laser-scanning microscope show expression pattern of V-ATPase ‘a’ subunit isoforms a1, a2, and a3 (green). Cultured cells were stained with antibodies specific for a2V-ATPase (red) along with B. plasma membrane marker, pan-cadherin (green) and C. early endosome marker, Rab5 (green). Colocalization was examined by confocal microscopy. Representative z-stack images are shown. Nucleus was stained with DAPI (blue). Scale bars: 10 μm. D. Non-permeabilized Breast cancer cells were cultured, fixed and subjected to surface staining of a2V. Stacked offset histograms are shown. Matched Isotype control from MDA-MB-468 is shown. E. Whole cell lysates from MCF7, SkBR3, MDA-MB-231 and MDA-MB-468 were harvested and subjected to Western blot analysis with specific antibody for a2V. β-actin was used as a loading control. DAPI: diamidino-2-phenylindole.
