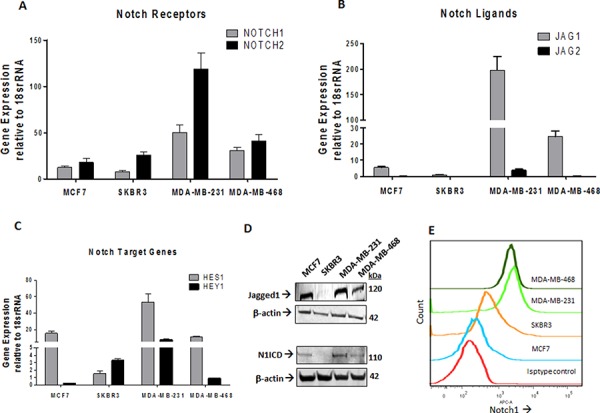
Figure 2. Expressions of Notch1 pathway genes are elevated in TNBC.

Total RNA extracted from MCF7, SKBR3, MDA-MB-231 and MDA-MD-468 cell lines was subjected to qRT-PCR analysis for mRNA levels of A. Notch receptors NOTCH1, NOTCH2 B. Notch ligands JAG1, JAG2 and C. Notch Target Genes HES1 and HEY1. Data represent mean ± standard error, n = 4. D. Protein level expression of Notch1 and Jagged 1 in these cell lines was examined by Western blot analysis. β-actin was used as a loading control. E. Surface staining of Notch1 in non-permeabilized cells is shown as stacked offset histograms. Matched Isotype control from MDA-MB-468 is shown.
