
Figure 1. Arenobufagin induces G2 cell cycle arrest in HCC cells.
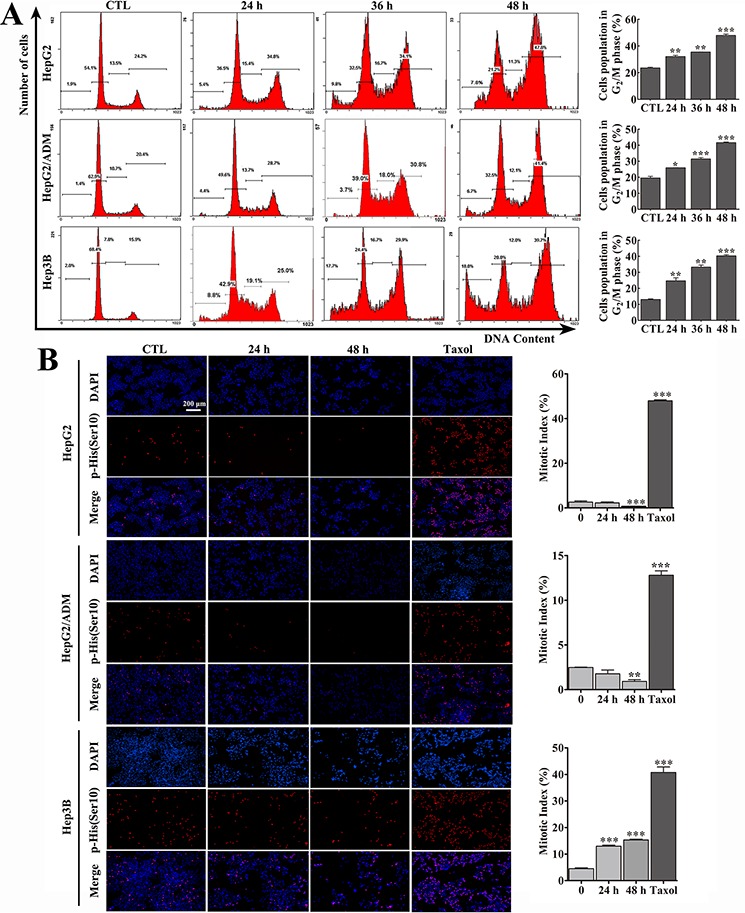
A. After treatment with 10 nmol/L (Hep3B cells) or 20 nmol/L (HepG2 and HepG2/ADM cells) of arenobufagin for 0, 24, 36, and 48 h, the cell cycle distributions were measured using flow cytometry. Representative pictures (left panel) and a quantification of the cell population in the G2/M phase (right panel) are shown. Each column represents the mean ± SD of at least three independent experiments. *P < 0.05, **P < 0.01, ***P < 0.001 versus the DMSO control. B. Effect of arenobufagin on the mitotic index in HCC cells. Cells were treated with arenobufagin for 0, 24 and 48 h and Taxel for 12 h (25 nmol/L for HepG2 and Hep3B cells, 5 μmol/L for HepG2/ADM cells) as a positive control. Representative pictures are shown (left panel). Original magnification: 100×; Scale bar: 200 μm. The mitotic indexes were calculated using the number of p-Histone H3-positive cells per total number of cells (DAPI-positive cells). Each column represents the mean ± SD of triplicates. **P < 0.01, ***P < 0. 001 versus the DMSO control (right panel).