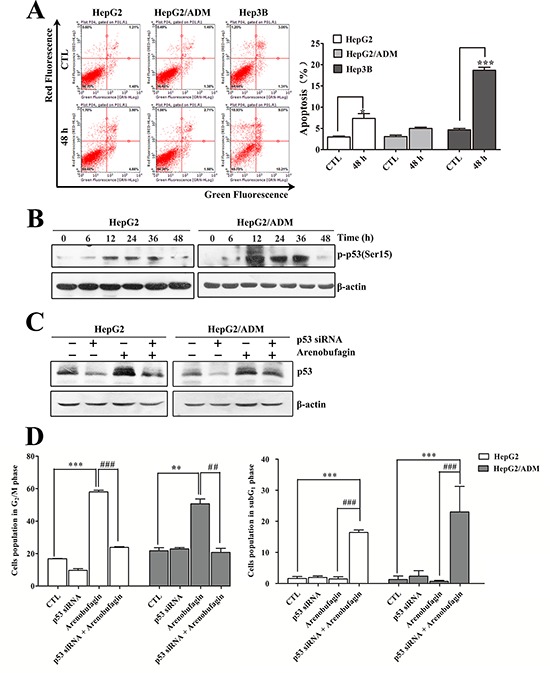
Figure 2. The role of p53 in arenobufagin-induced G2 arrest.

A. After treatment with arenobufagin for 48 h, the apoptotic cells were measured using flow cytometry. At least 10,000 cells were analyzed per sample. Representative pictures (left panel) and a quantification of the apoptotic cells (right panel) are shown. Each column represents the mean ± SD of triplicates. *P < 0.05, ***P < 0.001 versus the DMSO control. B. HepG2 and HepG2/ADM cells were incubated with arenobufagin for 0, 6, 12, 24, 36 and 48 h. The total protein cell lysates were harvested and evaluated by Western blotting with the indicated antibodies. C. The knockdown efficiency of p53 by siRNA in HepG2 and HepG2/ADM cells was evaluated by Western blotting. D. The effect of combined p53 siRNA and arenobufagin on the DNA content of HepG2 and HepG2/ADM cells. Cell cycle distributions of cells were assessed by flow cytometry. Each column represents the mean ± SD of at least three independent experiments. **P < 0.01, ***P < 0.001 versus the DMSO control; ##P < 0.01, ###P < 0.001 versus the arenobufagin alone.
