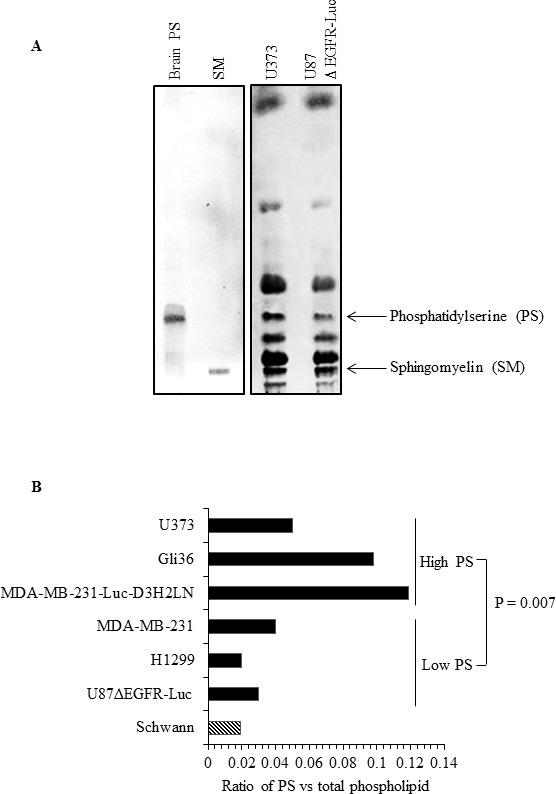
Figure 4. Human cancer cells differ in total cellular PS content.

A. TLC profile of phospholipids from U87ΔEGFR-Luc and U373 cell lines, with purified brain PS and SM run as molecular standards. B. Total PS estimated in the indicated cell lines by phosphorus assay from scraped PS bands obtained from TLC, expressed as the ratio of phosphorous obtained from scraped PS band and phosphorous from total phospholipids.
