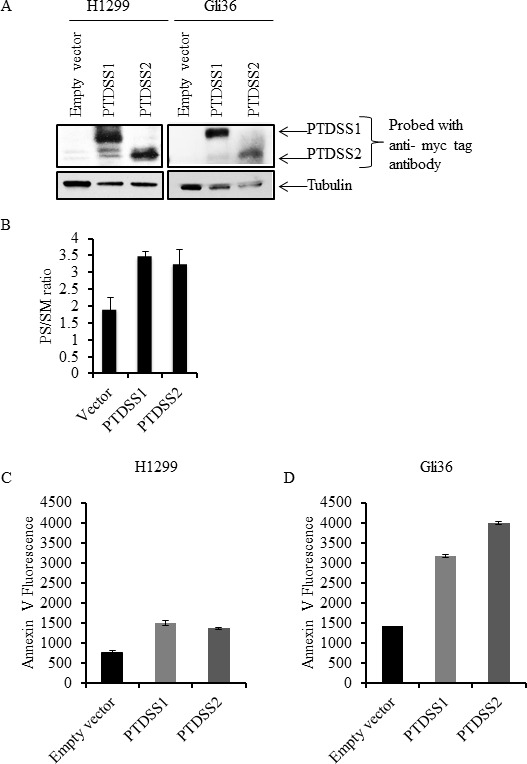
Figure 5. Overexpression of PS synthases PTDSS1 and PTDSS2 in human cancer cell lines increases surface PS.

A. Whole cell lysates from H1299 and Gli36 cells transfected with pIRESneo3/empty vector, pIRESneo3/myc-PTDSS1 or pIRESneo3/myc-PTDSS2 vectors were separated by SDS-PAGE and proteins were transferred on to nitrocellulose membrane. Expression of PTDSS1 and PTDSS2 was detected using anti-myc tag antibody. B. Lipids from H1299 cells transfected with indicated vectors and selected with G418, were separated by TLC and variations in PS are shown as the ratio of PS to SM. Transfected cells were stained with annexin V FITC to measure surface PS exposure. Annexin V FITC fluorescence was acquired by flow cytometry and its geometrical mean is shown for H1299 C. and Gli36 D. cells.
