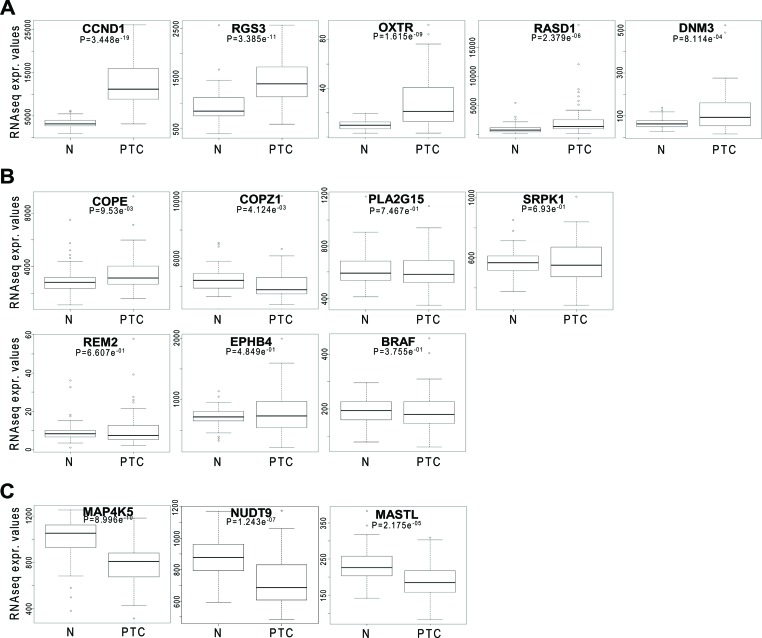
Figure 3. Hit gene expression levels in PTC.
Box plot distribution of RNAseq normalized expression values from the thyroid TCGA dataset of 15 selected genes in 58 matched normal (N) and PTC samples; A, B and C. represent genes overexpressed, equally or downregulated in PTC vs normal samples, respectively. The statistical significance of differences among the groups was assessed using Wilcoxon test.

