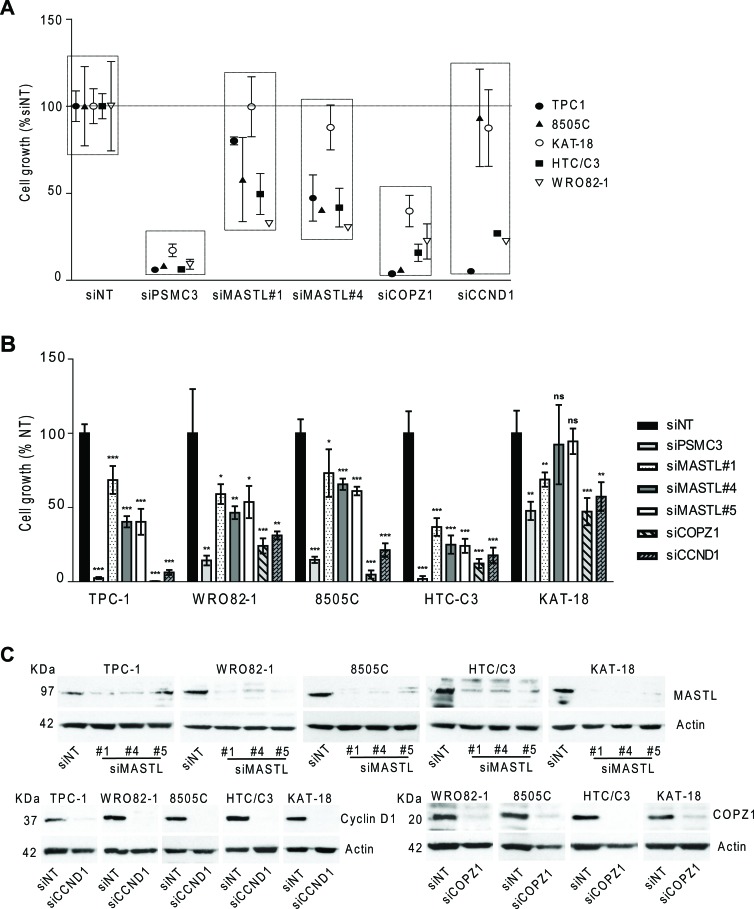
Figure 6. Effect of CCND1, MASTL and COPZ1 silencing on different thyroid tumor cell lines.
A. Scatter plot graph representing the percentage of cell growth (luminescence signal by CellTiter-Glo assay), normalized to that of Non Targeting oligo (siNT) 100%, 10 days after siRNA transfection in a panel of thyroid cell lines; siPSMC3 was used as positive control. One out of three representative experiment is shown. B. Cell proliferation assay 4 days (for TPC1, 8505C and HTC/C3 cells), 5 days (for KAT-18 cells), 6 days (for BCPAP cells), 7 days (for WRO82–1 cells) after siRNAs transfection; the growth rate was determined by the trypan blue exclusion assay. Cell count of viable cells was normalized to that of siNT (100%); data represent the mean +/− sd of two independent experiments; the asterisks indicate differences significant by the unpaired Student's t-test (*P < 0.05, **P < 0.01, ***p < 0.001). C. Western blot analysis of MASTL, Cyclin D1 and COPZ1 expression performed in the same samples of panel B; actin was used as loading control for cell extracts.

