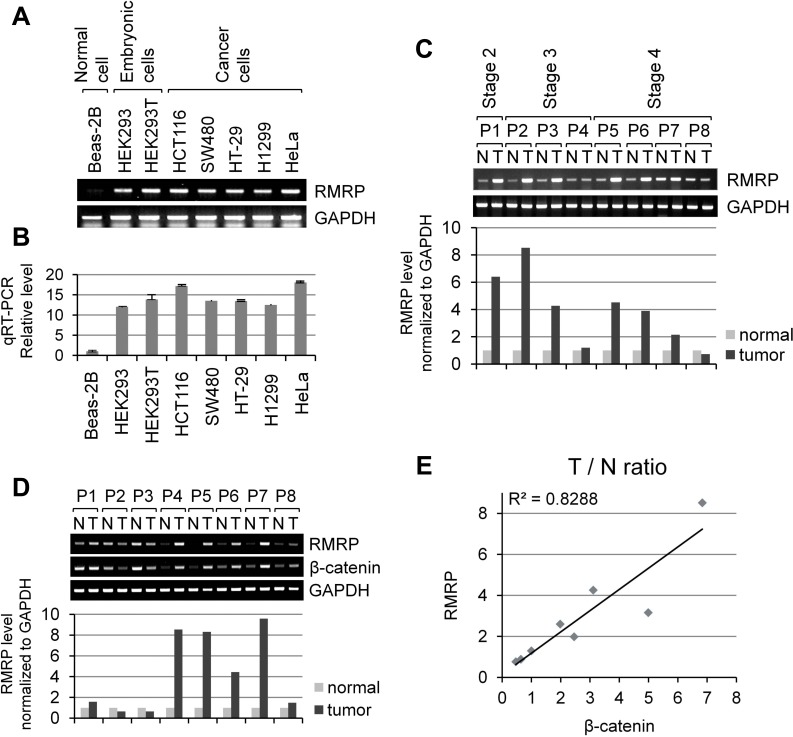
Figure 1. Elevated expression of RMRP level in tumor tissues and cancer cells.
A. RT-PCR analysis of RMRP levels in various cell lines: Beas-2B (non-malignant lung epithelial cell); HEK293 (embryonic kidney cell), HEK293T (HEK293 cells containing SV40 viral DNA); SW480 and HT-29 (colorectal adenocarcinoma cells); HCT116 (colorectal carcinoma cell); H1299 (lung epithelial, non-small cell carcinoma cells), and HeLa (cervical carcinoma cells). B. Relative RMRP level in various cell lines detected by qRT-PCR analysis (n = 3). C. RT-PCR analysis of RMRP expression levels in colorectal tumor patient tissues. A bar graph shows a relative level in tumor tissues versus normal tissues. P: patient, N: normal tissue, T: tumor tissue. D. RT-PCR analysis of RMRP expression levels in breast tumor patient tissues. A bar graph represents a relative RNA levels in tumor tissues versus normal tissues. P: patient, N: normal tissue, T: tumor tissue. E. Correlation between RMRP and β-catenin mRNA levels from normal and tumor tissues in breast cancer patients. T/N ratio: RNA level in tumor tissues/RNA level in normal tissues.

