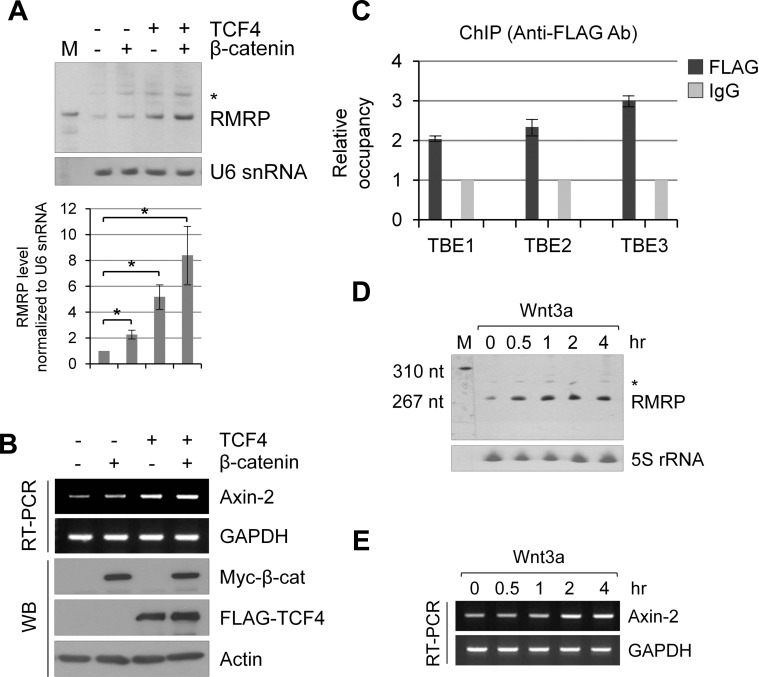
Figure 2. Wnt/β-catenin/TCF4 induced RMRP expression.
A. Northern blot analysis of RMRP level in HEK293 cells following myc-β-catenin and/or FLAG-TCF4 overexpression. * represents aberrant RMRP bands (about 50 bp longer than normal size). A bar graph shows RMRP level from three independent experiments. Mean and standard deviation were presented (*p < 0.01). B. RT-PCR analysis of Axin-2 mRNA expression levels from the samples of A.. C. Chromatin immunoprecipitation (ChIP) analysis of RMRP promoter using anti-FLAG antibodies following transfection of FLAG-β-catenin in HEK293 cells. Relative occupancy of FLAG-β-catenin in comparison to IgG for three putative TBEs (TCF Binding Elements) upstream of RMRP gene are shown. A bar graph shows qPCR analysis of ChIP analysis (n = 3). D. Northern blot analysis of RMRP level in HEK293 cells following Wnt3a treatment for various times (0, 0.5, 1, 2 and 4 hrs). 5S rRNA was used as a control. E. Expression of Axin-2 mRNA as measured by RT-PCR experiments from the samples of D..

