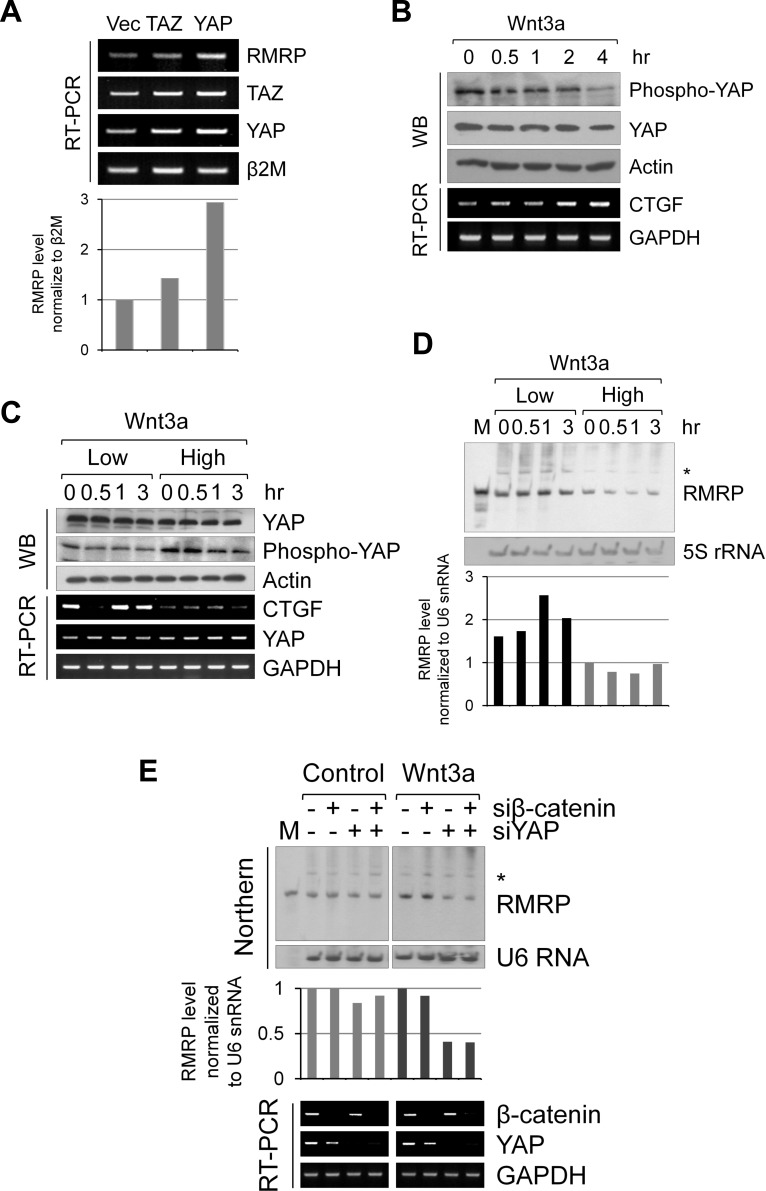
Figure 3. Augmented expression of RMRP by Hippo/YAP pathway.
A. RT-PCR analysis of RMRP expression levels in Beas-2B cells following transfection of FLAG-TAZ and FLAG-YAP. A bar graph shows densitometer scanning of above gel. B. Western blot analysis of YAP protein level and phosphorylation status in HEK293 cells following Wnt3a treatment for various times (0, 0.5, 1, 2 and 4 hrs). RT-PCR analysis indicates YAP target gene CTGF mRNA expression levels. C. Western blot analysis of YAP protein level and phosphorylation status following Wnt3a treatment (0, 0.5, 1 and 3 hrs) of HEK293 at low and high cell density. RT-PCR analysis of YAP target gene CTGF mRNA is also shown. D. Northern blot analysis of RMRP expression levels from the samples of C.. 5S rRNA was also detected as a control. Densitometer scanning of above gel is also shown. E. Northern blot analysis of RMRP level following Wnt3a or control medium (1hr) treatment to the HEK293 cells silencing with si-β-catenin and si-YAP. A bar graph represents densitometer scanning of above gel. RT-PCR analysis indicates silencing efficiency of the samples.

