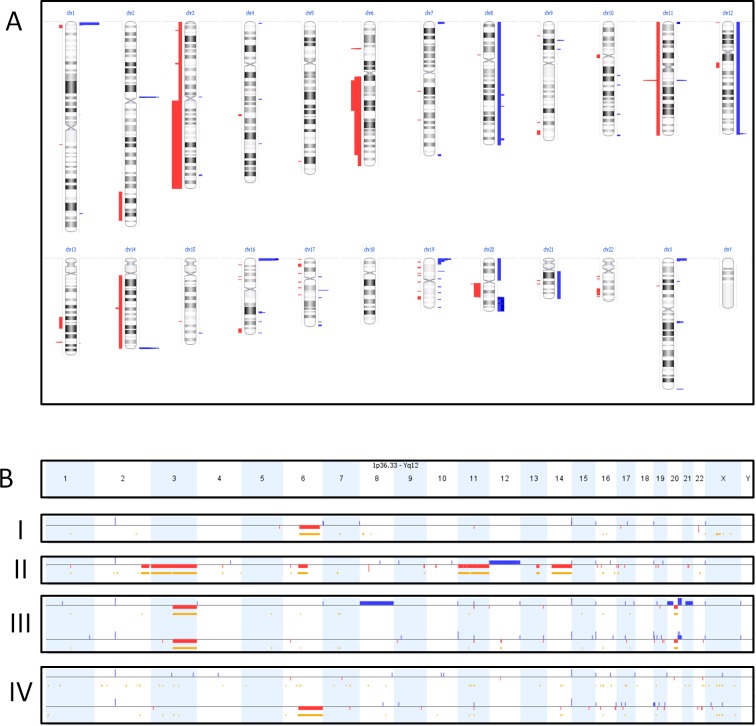
Figure 3. Oncoscan results.
Figure 3A shows an overview of the number of copy-number-variations in 6 synovial sarcomas with aggregated gains (blue) and losses (red) of the different cases. The width of the bars indicates the number of cases with the gain or loss. Figure 3B shows the copy number variations per sample (one per row). Gains and losses of the different chromosomes are represented by respectively blue and red lines, under the different chromosomes (depicted in columns). The length of these lines indicates the size of the gain or loss. The yellow/orange lines indicate loss of heterozygosity. BI and BII are two individual lesions showing a partial loss of chromosome 6q. BIII is a primary lesion (top line) with its corresponding metastasis (bottom line), showing a partial overlap of chromosomal aberrations but also differences. BIV are two metastases from the same patient. It shows a new deletion of chromosome 6q in the progressive metastasis under pazopanib treatment (bottom) compared to the metastasis responding to pazopanib (top).

