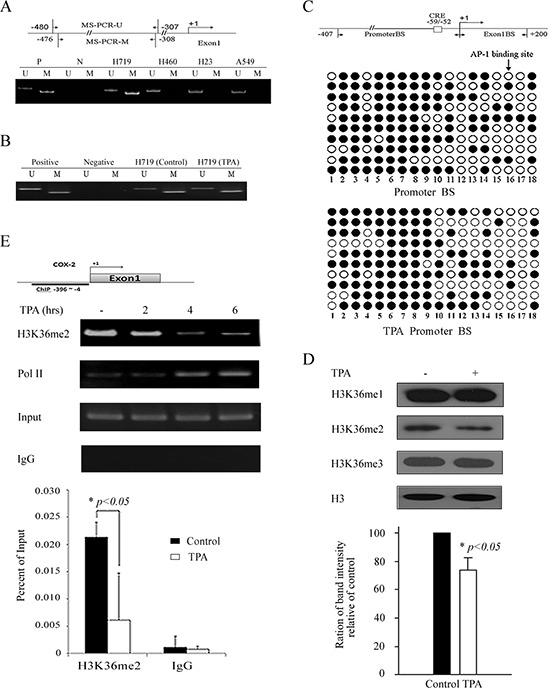
Figure 2. TPA reactivates COX-2 expression without affecting the DNA methylation status of its promoter but associates with H3K36 methylation.

A. DNA methylation status of the COX-2 promoter in H719, H460, H23 and A549 cells was detected by MSP. A schematic of the COX-2 promoter and regions (−480 to −307, −476 to −308) selected for DNA methylation detection. M indicates a methylated band and U indicates an unmethylated band. B. H719 cells were treated with TPA for 6 hrs at 100 ng/mL, then MSP was used to detect the DNA methylation status of the COX-2 promoter before and after TPA treatment. M indicates a methylated band and U indicates an unmethylated band. C. Bisulfite sequencing analysis of the COX-2 promoter, which contains 18 CpG dinucleotides in H719 cells. A schematic of two regions, referred to as Promoter BS (−407 to +1) and Exon1 BS (+1 to +200), that were selected for bisulfate sequencing detection. AP-1 binding sites were labeled as CRE. More than ten independent clones of this cell line were sequenced. The promoter region showed 62.0% (112 methylated at a total of 180 sites) and 60.6% (109 methylated at a total of 180 sites) methylation before and after TPA treatment in H719 cells, respectively. Filled circle indicates methylated sites, and open circle indicates unmethylated sites. D. H719 cells were treated with 100 ng/mL TPA for 6 hrs, followed by Western blotting to determine the changes in H3K36 methylation patterns. H3 is shown as a loading control. H3K36me2 bands were scanned, and the relative band intensities were normalized for each H3 band. The band intensity of the control was set as 100; the numerical value of the intensity of each band represents the percentage of the band intensity with respect to that of the control. The representative value in the lower column diagram is an average relative band intensity of H3K36me2, with standard error shown from three independent experiments. *, p < 0.05. E. H719 cells were treated with TPA at 100 ng/mL for various intervals (0, 2, 4 and 6 hrs) and harvested for a ChIP assay to detect the enrichment of H3K36 me2 around the COX-2 promoter (the upper panel). The bands containing anti-IgG served as negative controls. ChIP-qPCR assay was also used to detect the changes in the enrichment of H3K36 me2 at the COX-2 promoter after 4 hrs of TPA treatment (the lower panel). *, p < 0.05.
