
Figure 2. IHC analyses of CK2α protein expression in primary HCC surgical specimens and Kaplan–Meier survival analyses of the primary HCC patients (n = 98).
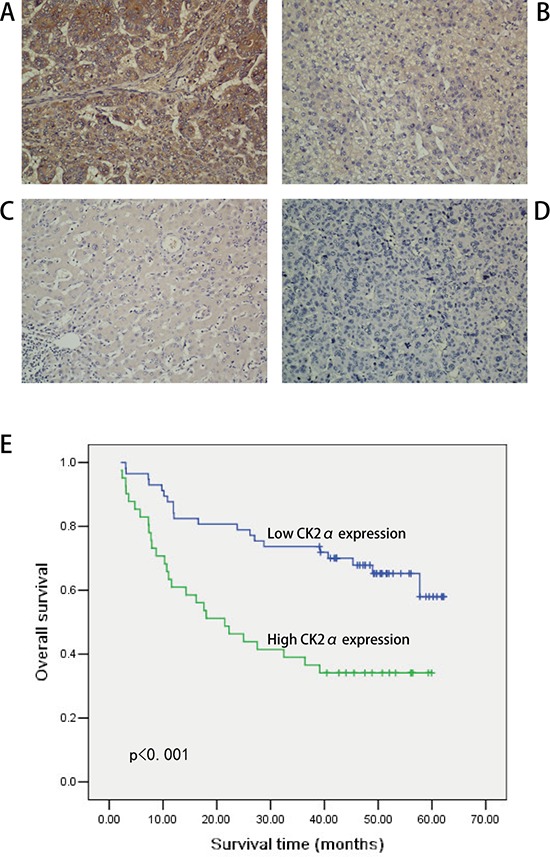
A. Strong CK2α staining in HCC, scored as CK2α (+++). B. Moderate CK2α staining in HCC, scored as CK2α (++). C. Weak CK2α staining in HCC, scored as CK2α (+). D. CK2α-negative staining in HCC, scored as CK2α (−). All images are shown at × 200 magnification. E. Based on CK2α immunostaining analysis of their tumors, HCC patients were divided into low-CK2α expression (n = 56, CK2α- or CK2α+) and high-CK2α expression (n = 42, CK2α++ or CK2α+++) groups. Survival of patients in the low-CK2α group was significantly higher than that of patients in the high-CK2α group (P < 0.001, log-rank test).