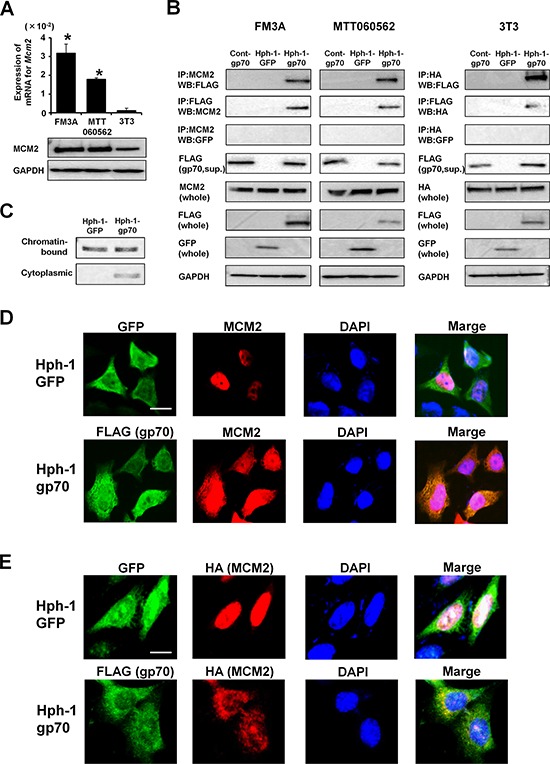
Figure 3. Hph-1-gp70 binds MCM2 directly.

A. Quantitative RT-PCR analysis of Mcm2 mRNA expression (top) and western blotting analysis of MCM2 (bottom) in FM3A, MTT060562, and 3T3 cells. *P < 0.01 vs. 3T3 cells by two-tailed Student's t-test. B. FM3A (left), MTT060562 (middle), and HA-Mcm2-expressing 3T3 cells (right) were treated with 1 μM control-gp70, Hph-1-GFP, or Hph- 1-gp70 for 2 h. Cell lysates were subjected to pull-down assays to assess the binding of MCM2 to gp70. C. FM3A cells were treated with 1 μM Hph-1-GFP or Hph-1-gp70 for 2 h. Cell lysates from these cells were separated into chromatin-bound and cytoplasmic fractions. MCM2 protein was analyzed with western blotting. D. MTT060562 cells were treated with 1 μM Hph-1-GFP or Hph-1-gp70 for 2 h. FLAG-positive cells containing the gp70-derived proteins are shown in green (FITC). Endogenous MCM2-positive cells are shown in red (TRITC). DAPI-stained nuclei are shown in blue. Images were acquired using a BZ-9000 microscope (KEYENCE) with a 400 × objective. Scale bar indicates 25 μm. E. HA-Mcm2-expressing 3T3 cells were treated with 1 μM Hph-1-GFP or Hph-1-gp70 for 2 h. FLAG-positive cells containing the gp70-derived proteins are shown in green (FITC). HA-positive cells containing the MCM2-derived proteins are shown in red (TRITC). DAPI-stained nuclei are shown in blue. Images were acquired using a BZ-9000 microscope (KEYENCE) with a 400 × objective. Scale bar indicates 25 μm.
