
Figure 5. Inhibition of de novo fatty acid synthesis or palmitoylation alters EGFR cellular distribution and reduces total EGFR levels.
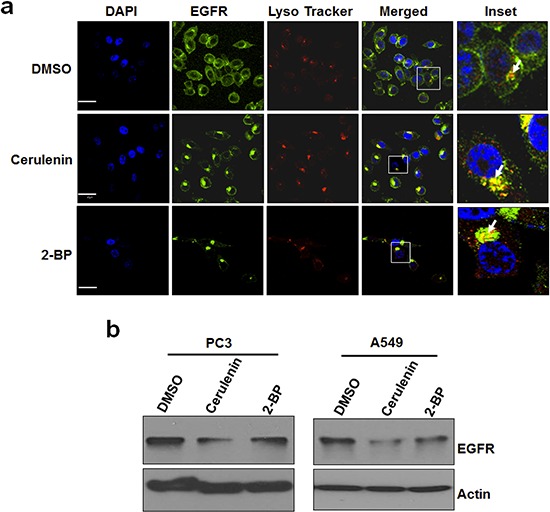
a. Representative immuno fluorescent images of PC3 cells. PC3 cells were treated with DMSO or cerulenin at 5 ug/ml for 24 hours and stained for EGFR (green), lysosomes (red) and nucleus (DAPI, blue). Images were taken using Olympus confocal microscope using 60x objective. Scale bar is 30um. b. Western blot analysis of protein samples for EGFR and Actin isolated from PC3 cells and A549 cells treated with FASN inhibitor, cerulenin at 5ug/ml or 2-BP (6 uM) for 24 hours.