
Figure 6. FASN or PAT inhibitor sensitizes cancer cells to EGFR TKIs.
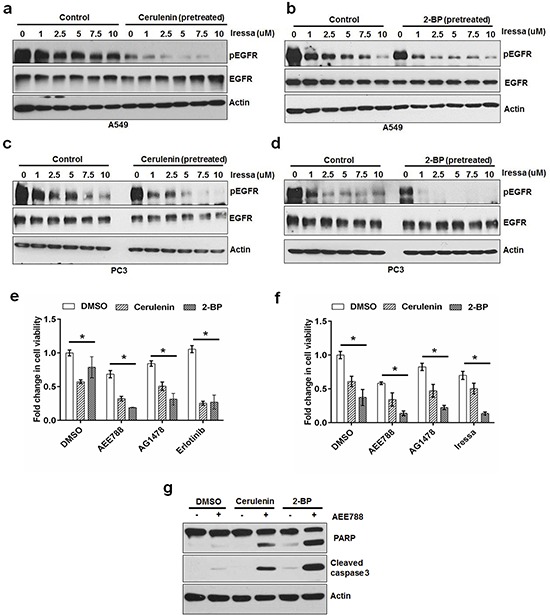
Western blot analysis of protein samples for pEGFR, EGFR and Actin isolated from A549 cells treated (30 minutes) with increasing concentrations of EGFR tyrosine kinase inhibitor in the presence or absence of cerulenin at 5 ug/ml a. or 2-BP at 8 uM b. The cells were pretreated with either cerulenin or 2-BP for 5 hours before the treatment with Iressa. Western blot analysis of protein samples for pEGFR, EGFR and Actin isolated from PC3 cells treated (30 minutes) with increasing concentrations of EGFR tyrosine kinase inhibitor in the presence or absence of cerulenin at 5 ug/ml c. or 2-BP at 8 uM d, e. MTS assay in PC3 cells treated with EGFR TKI alone or in combination with cerulenin or 2-BP for 48 hours. f. MTS assay in A549 cells treated with EGFR TKI alone or in combination with cerulenin or 2-BP for 48 hours. Data are means of +/− SD of triplicates. Asterisk indicates the statistical significance between treated group and DMSO (P-value ≤ 0.001). g. Western blotting analysis of protein samples for PARP cleavage, cleaved caspase 3 and actin.