
Figure 3. Visualization of putative CSCs of NPC with a “CSC detector”.
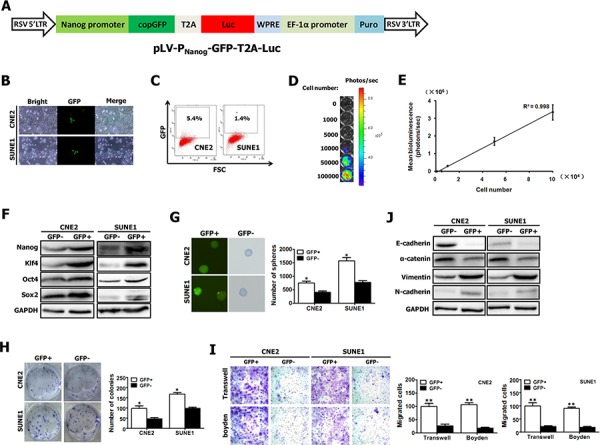
A. Schematic diagram of lentiviral vector pLV-PNanog-GFP-T2A-Luc, in which GFP and Luc expression was controlled by human Nanog promoter. The construct map is not drawn to the scale. Abbreviations: Luc: firefly luciferase; GFP: green fluorescent protein. B–C. Representative GFP expression was measured in NPC cell lines (e.g., CNE2 and SUNE1) carrying PNanog-GFP-T2A-Luc transgene by inverted fluorescence microscope (B) and by flow cytometry (C). D. CNE2 cells harboring Luc have robust reporter gene expression as shown by bioluminescence imaging (BLI). E. A strong correlation exists between BLI signal and CNE2 cell number. F–G. GFP+ and GFP- fractions sorted from CNE2 and SUNE1 cells carrying PNanog-GFP-T2A-Luc transgene (shown in Fig. 3B, 3C) by fluorescence-activated cell sorting (FACS) were subjected to Western blotting for the detection of Nanog, Oct4, Sox2 and Klf4 expression (F), and tumor spheroid formation assay (G). H–I. The growth (H), migration (I) and invasion (I) of GFP+ and GFP- NPC cells were evaluated by colony formation assay, transwell migration assay and matrigel-coated Boyden chamber assay, respectively. GFP+ and GFP- fractions were sorted from CNE2 and SUNE1 cells carrying PNanog-GFP-T2A-Luc transgene (shown in Fig. 3B, 3C) by FACS. J. GFP+ and GFP- fractions sorted from CNE2 and SUNE1 cells carrying PNanog-GFP-T2A-Luc transgene (shown in Fig. 3B, 3C) by FACS were subjected to Western blotting for the detection of E-cadherin, α-catenin, vimentin and N-cadherin expression.