. 2016 Feb 4;12(2):e1004655. doi: 10.1371/journal.pcbi.1004655

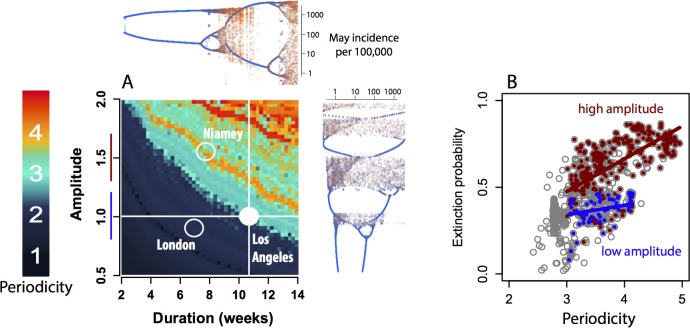
Fig 4. (A) Bifurcation plot for the deterministic skeleton of the seasonally forced TSIR model parameterized for Los Angeles, US, as a function of the duration of the period of low transmission (horizontal axis) and the relative amplitude of seasonal fluctuations (vertical axis) (see S1 Text). Colors indicate the mean periodicity of the resulting dynamics, showing two distinct routes to deterministic chaos. Marginal plots show the predicted number of cases in Los Angeles each May, as seasonal amplitude and duration of the seasonal low-transmission period are varied one at a time. Hollow circles indicate the approximate locations of London, UK, and Niamey, Niger on the bifurcation plot. Simulations were run for 100 years following 100 years of burnin to remove transient dynamics. (B) Proportion of biweeks with <1 case for each of the simulations shown in the main bifurcation diagram (grey circles), for simulations with seasonal transmission amplitudes near 1.0 and with positive Lyupanov exponents (blue circles, and blue line on the vertical axis of the adjacent subfigure), and for simulations with seasonal transmission amplitudes near 1.5 and with positive Lyupanov exponents (red circles, and red line on the vertical axis of the adjacent figure).

Fig 4