
Figure 5. CSCs with high mitochondrial mass preferentially survive paclitaxel treatment and show reduced DNA strand breaks.
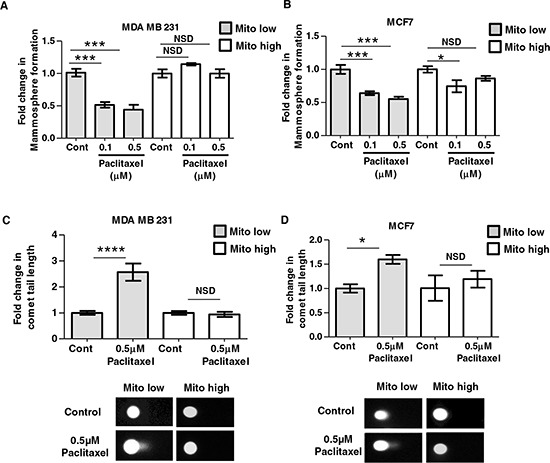
MDA MB 231 and MCF7 cells were subjected to flow-cytometry to isolate different populations of MitoTracker stained cells: mito-low = lowest 5% of MitoTracker stained cells; mito-high = highest 5% of MitoTracker stained cells. Mito-high and low populations were then seeded into mammosphere culture in the presence or absence of paclitaxel (A–B) or treated with paclitaxel or control (DMSO 1:10,000) for 24 h before DNA damage analysis via a comet assay (C–D). A–B. Graphs show fold change in mammosphere formation in mito-low and mito-high cells (MDA MB 231 and MCF7), after treatment with 0.1 μM and 0.5 μM paclitaxel compared to vehicle alone controls, n = 3 independent experiments, ≥3 technical replicates. C–D. Graph shows fold change in comet tail length in mito-low and mito-high cell populations (MDA MB 231 and MCF7), after 24 h of 0.5 μM paclitaxel treatment, the images show representative comet tails under all conditions. Bar graphs are shown as the mean ± SEM, (ANOVA) test with post-hoc dunetts multiple comparisons (A–B), t-test, two-tailed test (C–D), **P ≤ 0.01, **** ≤ 0.0001.