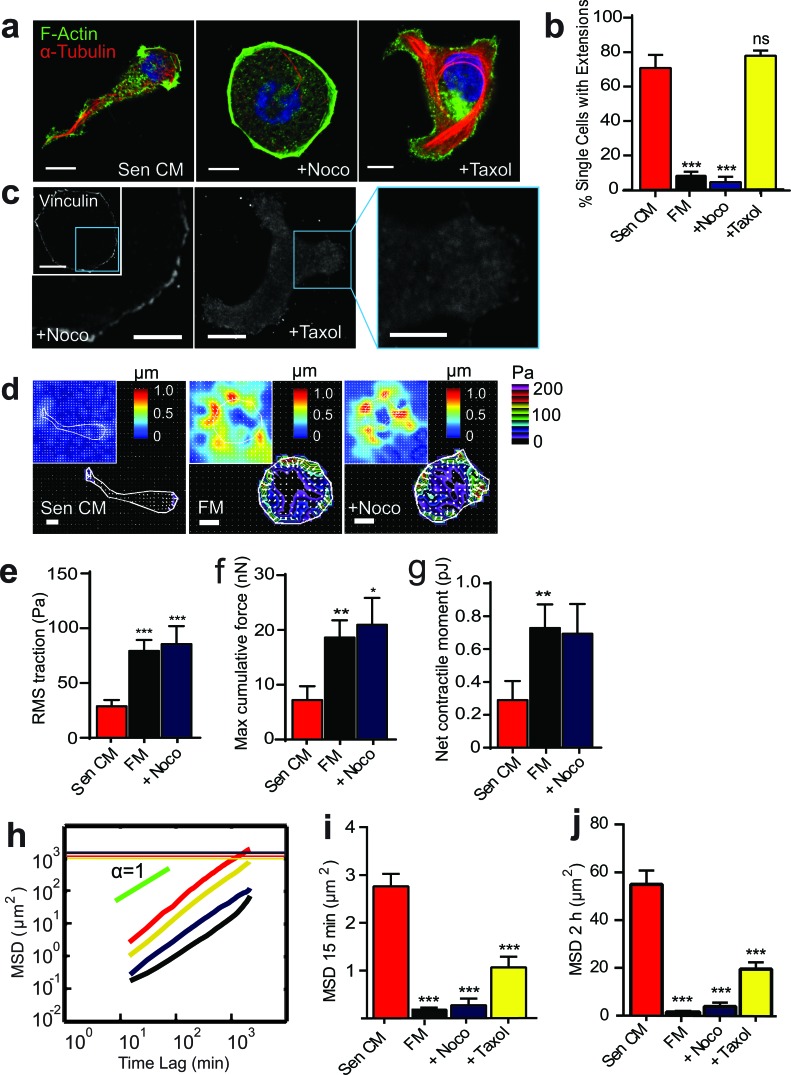
Figure 3. Microtubule integrity and dynamics are required for SASP-induced migration and change in morphology.
a. Fluorescence confocal micrographs of T47D cells after 48h exposure to Sen CM, Sen CM + 0.5 μg/ml nocodazole (Noco) or Sen CM+ 1 μM taxol, respectively, for 48h. Cells are stained for F-actin (green), α-tubulin (red) and nuclear DNA (blue). Scale bar, 10 μm. b. Percentage of single cells with extensions when exposed to Sen CM (n = 147), Fresh media (FM) (n = 57), Sen CM+Noco (n = 50), Sen CM+Taxol (n = 54), respectively, after 48h. P = 0.1801for Sen+Taxol c. Fluorescence confocal micrographs of cells exposed to Sen CM+Noco and Sen CM+Taxol stained for vinculin, where blue boxes indicate zoomed region of T47D cells. Scale bar, 10 μm in original image and 5 μm in zoomed image. d. Bead displacement and traction field of T47D cells placed on a 1300 Pa compliant polyacrylamide gel and exposed to Sen CM (n = 25), SF (n = 25), Sen CM+Noco (n = 18). Scale bar, 10 μm. e.-g. RMS traction stresses e. Maximum cumulative force f. and Net contractile moment g. of Sen CM and Sen CM+Noco exposed cells. h. Population-averaged mean squared displacement (MSD) as a function of time lag of T47D cells when exposed to Sen CM (red; n = 94), FM (black; n = 29), Sen CM+Noco (purple; n = 57), Sen CM+Taxol (yellow; n = 45). Red, purple, and yellow horizontal lines are the averaged sizes of T47D cell under each condition, and indicate that only cells exposed to Sen CM translocated more than their size over the 36 h of cell tracking. i. and j.. Averaged MSD evaluated at time lags of 15 min i. and 2 h j.. n = 94, n = 57, n = 45, respectively. ***P < 0.001 compared to cells exposed to Sen CM alone.

