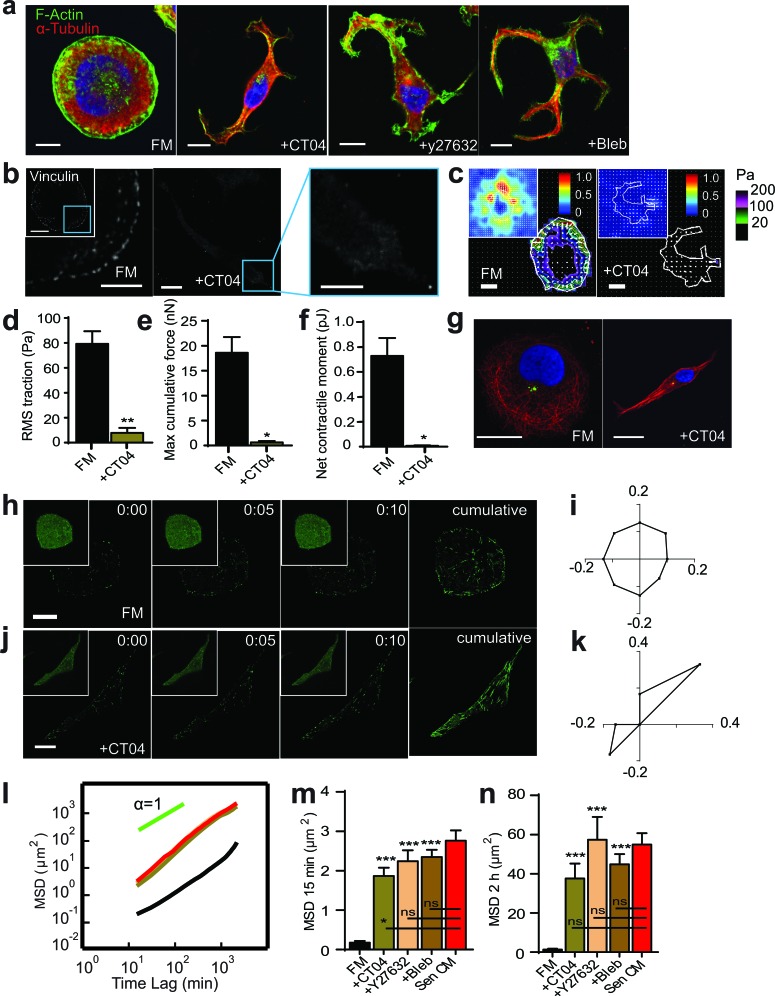
Figure 6. RhoA/ROCK/Myosin II inhibition recapitulates SASP-induced phenotype.
a. Fluorescence confocal micrographs of T47D cells after 48h exposure to FM, FM+25 μM Blebbistatin (Bleb) or FM+2.0 μg/ml CT04 respectively for 48h. Cells are stained for F-actin (green), α-tubulin (red) and nuclear DNA (blue). Scale bar, 10 μm. b. Fluorescence confocal micrographs of cells exposed to FM and FM+CT04 stained for vinculin, where blue boxes indicate zoomed region of T47D cells. Scale bar, 10 μm in original image and 5 μm in zoomed image. c. Bead displacement and traction field of T47D cells placed on a 1300 Pa compliant polyacrylamide gel and exposed to SF and SF+CT04. n = 25 and n = 5 respectively. Scale bar, 10 μm. (d-f) RMS traction stresses d. Maximum cumulative force e. and Net contractile moment f. of Sen CM and Sen CM+Noco exposed cells. g. T47D cells immunostained for α-tubulin (red), pericentrin (green), and nuclear DNA (blue) after exposure to FM (first panel) and FM+CT04 (second panel) for 48h. Scale bar, 10 μm. h.-k. T47D cells transfected with EB1-EGFP then exposed to FM and FM+CT04 for 24h are displayed every 5s for 10s for first 3 panels with a cumulative image shown in the last panel. Original images are displayed as inset per image. Scale bar, 10 μm. i. and k. Angular distributions of EB1-EGFP comets within FM i. and FM+CT04 k. cells within both cell center and periphery. n = 30 comets per cell. l.. Population-averaged mean squared displacement (MSD) cells as a function of time lag for T47D exposed to FM (black; n = 29), FM+Bleb (brown; n = 60), FM+y27632 (tan; n = 68), FM+CT04 (green) and Sen CM (red; n = 94). (n and o). Averaged MSD evaluated at time lags of 15 min m. and 2 h n.. *P < 0.05, **P < 0.01 and ***P < 0.001.

